
Docs · User guide
How to use the DSEAfrica Data Lab
From your first sign-in to a portfolio you can send to an employer. Sixteen short chapters with screenshots of every screen. Read it top to bottom, or jump to the part you need.
Chapter 1
Getting started
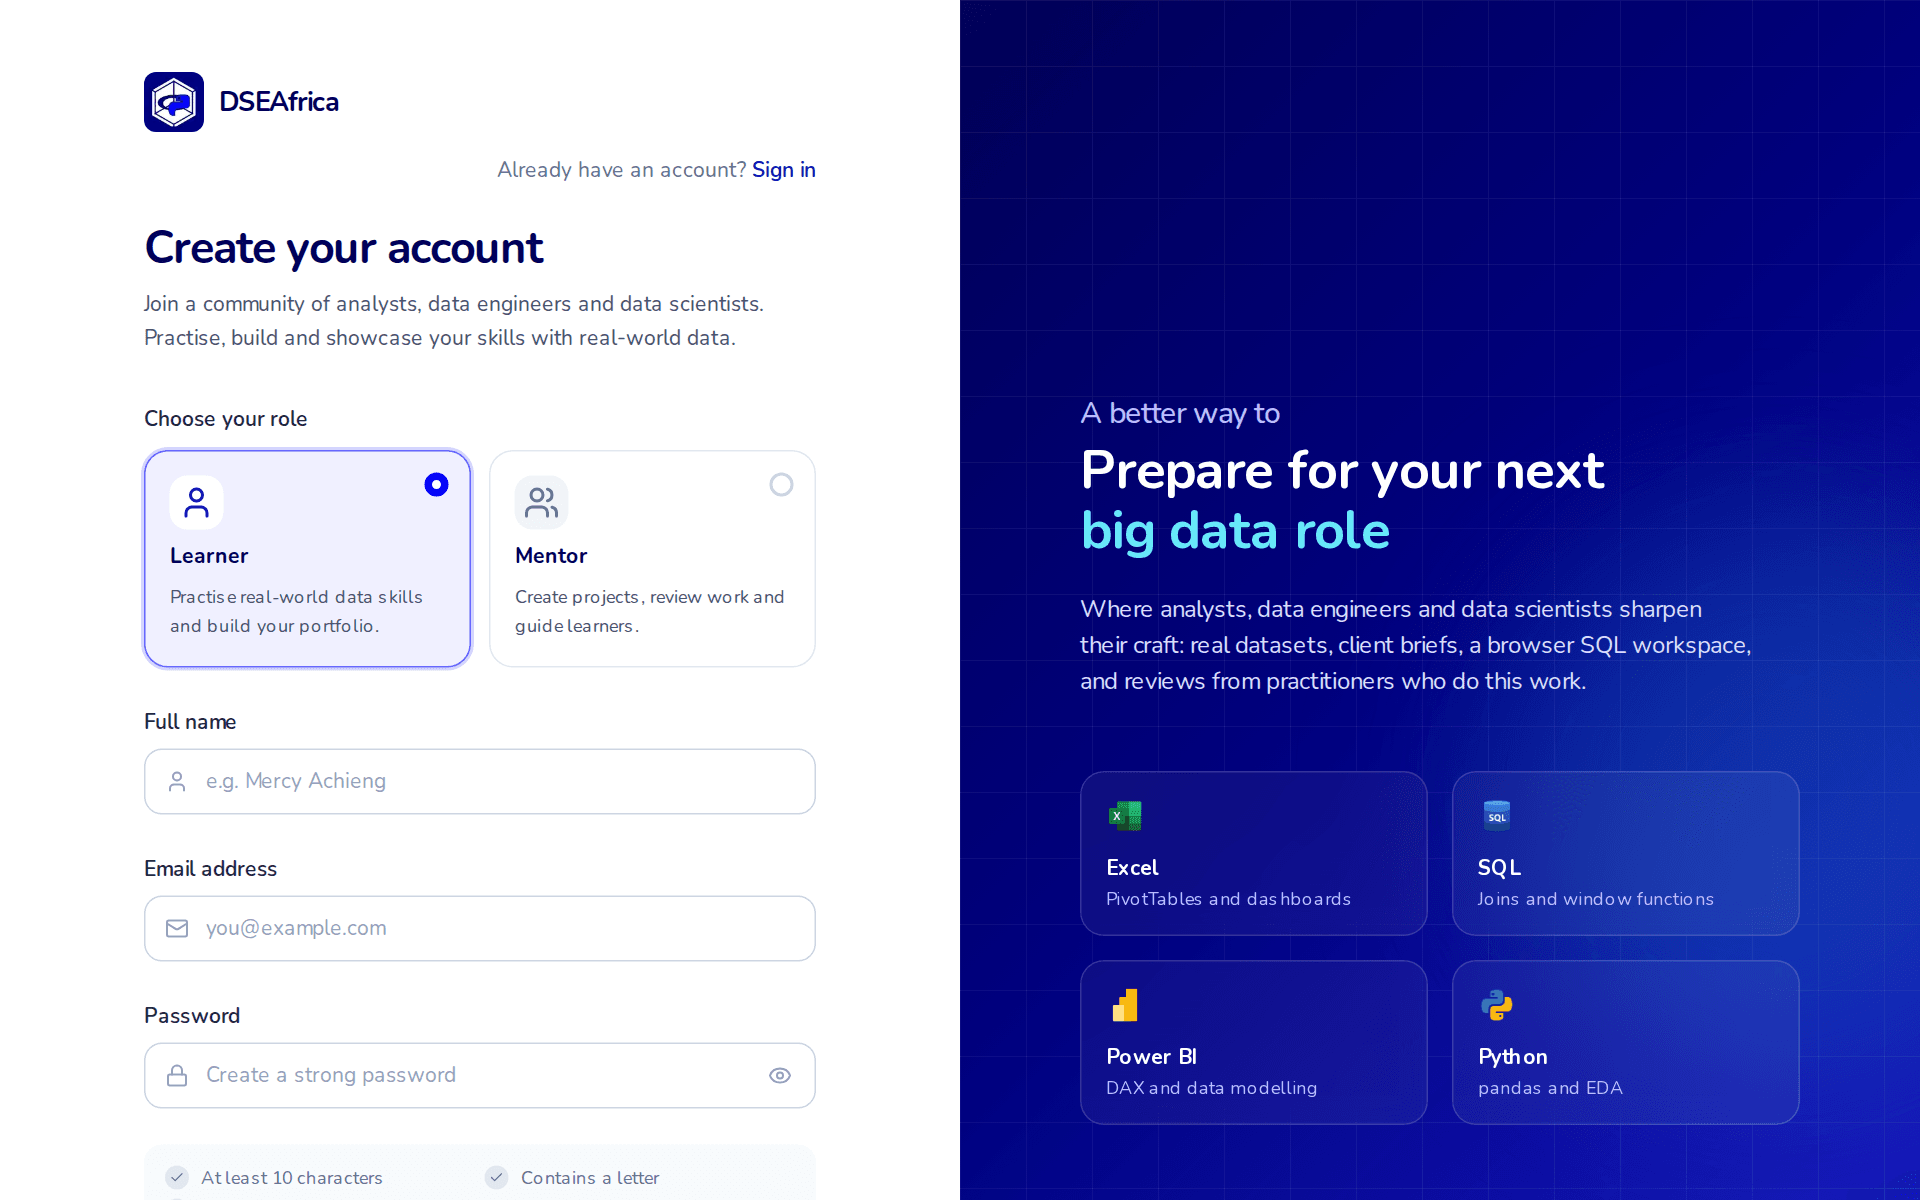
Create an account
- Open Sign up and choose Learner or Mentor. Mentor accounts are reviewed by an administrator before they can publish projects; most people join as a Learner.
- Enter your full name, email address and a password. Passwords need at least ten characters with a letter and a number. Click the eye icon to check what you typed.
- Open the verification email and follow the link. Until you verify, some features stay off and your dashboard reminds you.
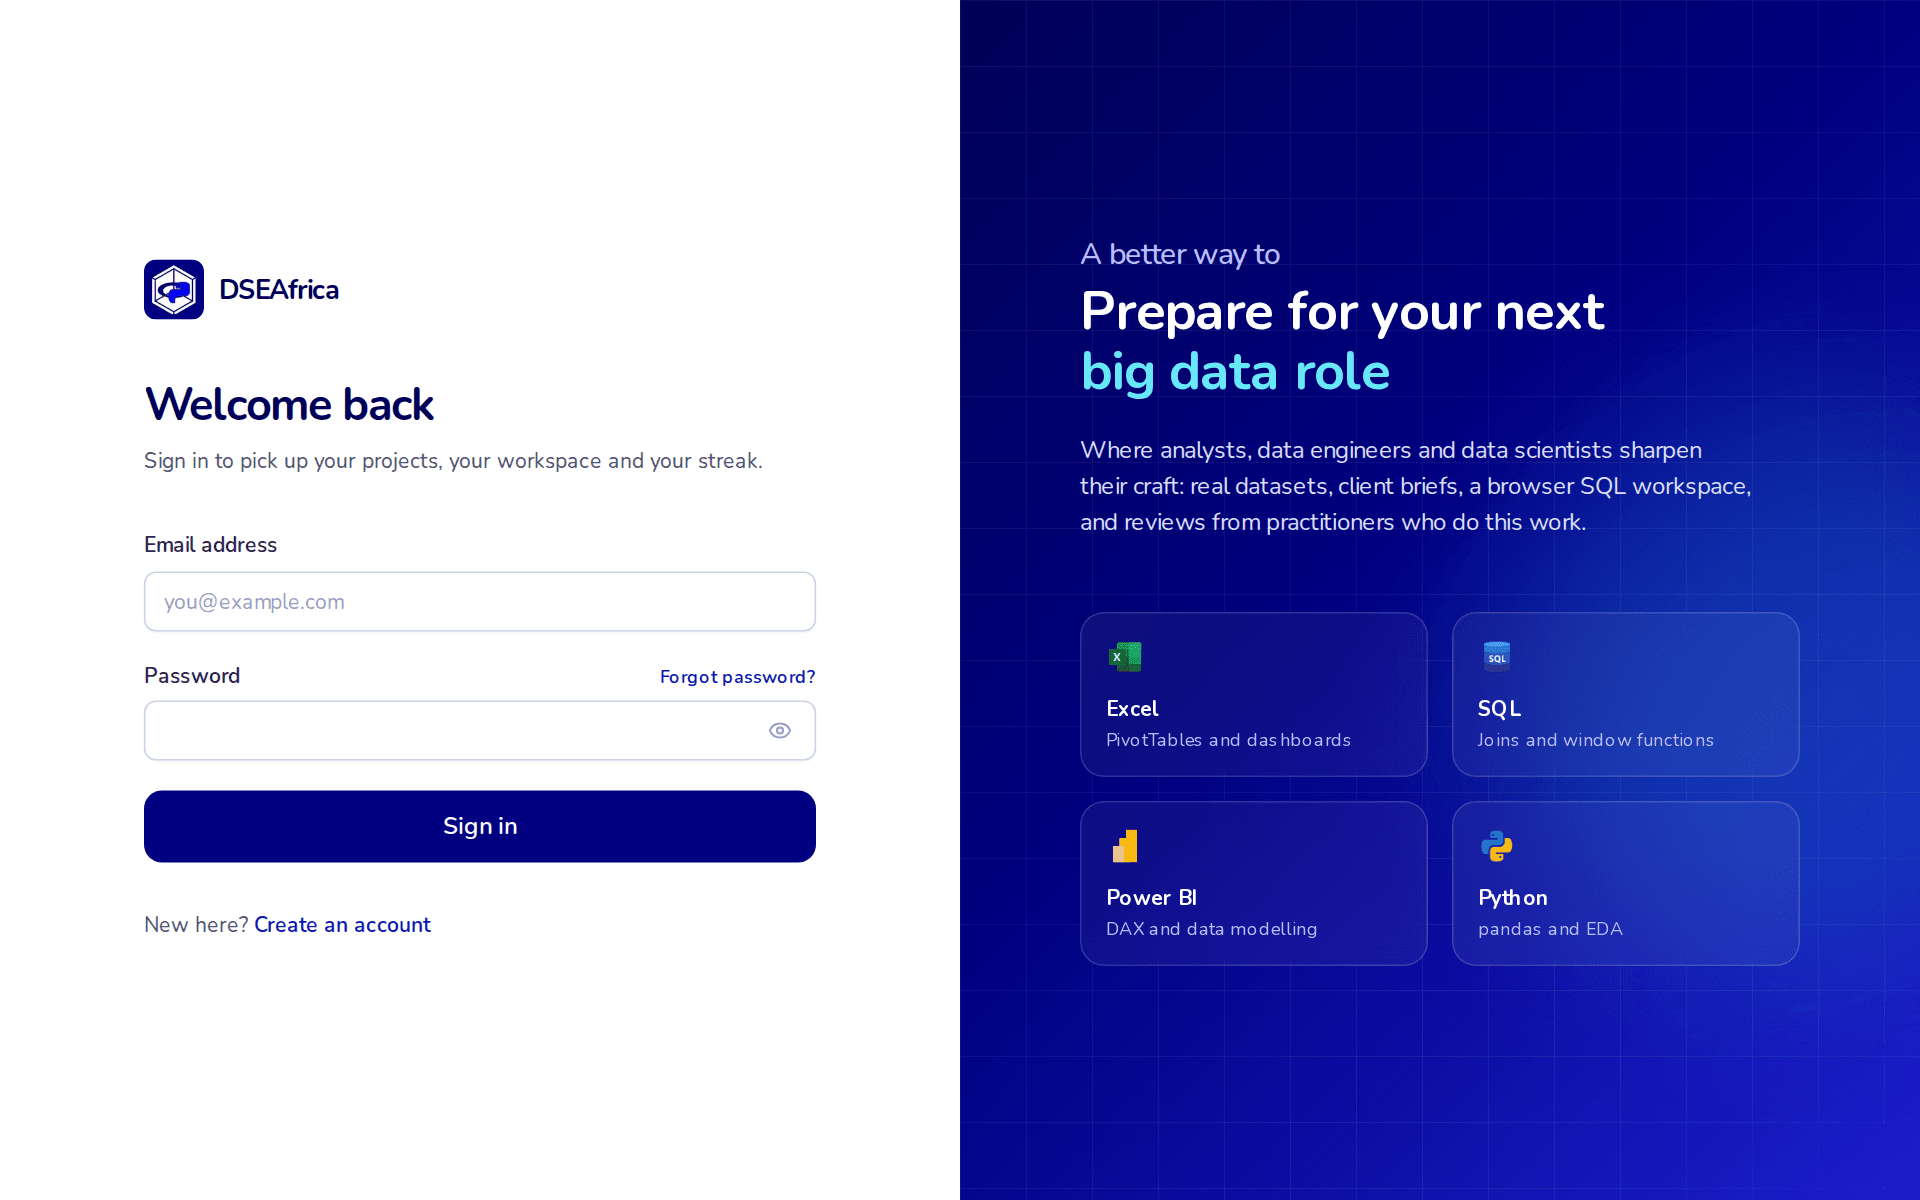
- Sign in from the Sign in page. If you forget your password, use Forgot password? on that page and a reset link is emailed to you.
Onboarding
The first time you sign in, a short wizard asks which tools you want to practise (Excel, SQL, Power BI, Python) and your current level (Beginner, Intermediate, Advanced). Your answers shape what the dashboard suggests first. Nothing is locked by these choices, and you can change them later in Settings.
Chapter 2
Your dashboard
The dashboard is deliberately small. It shows one thing to do next, your practice streak, your progress by tool, and the latest feedback from a mentor.
- Next up. The brief you are working on, or a suggested first brief if you have not started one.
- Streak. Solving one graded exercise a day keeps it going. Miss a day and it resets.
- Progress by tool. How far you are through the projects for each tool you chose.
- Latest feedback. The most recent marking decision, with a link to the full rubric scores.
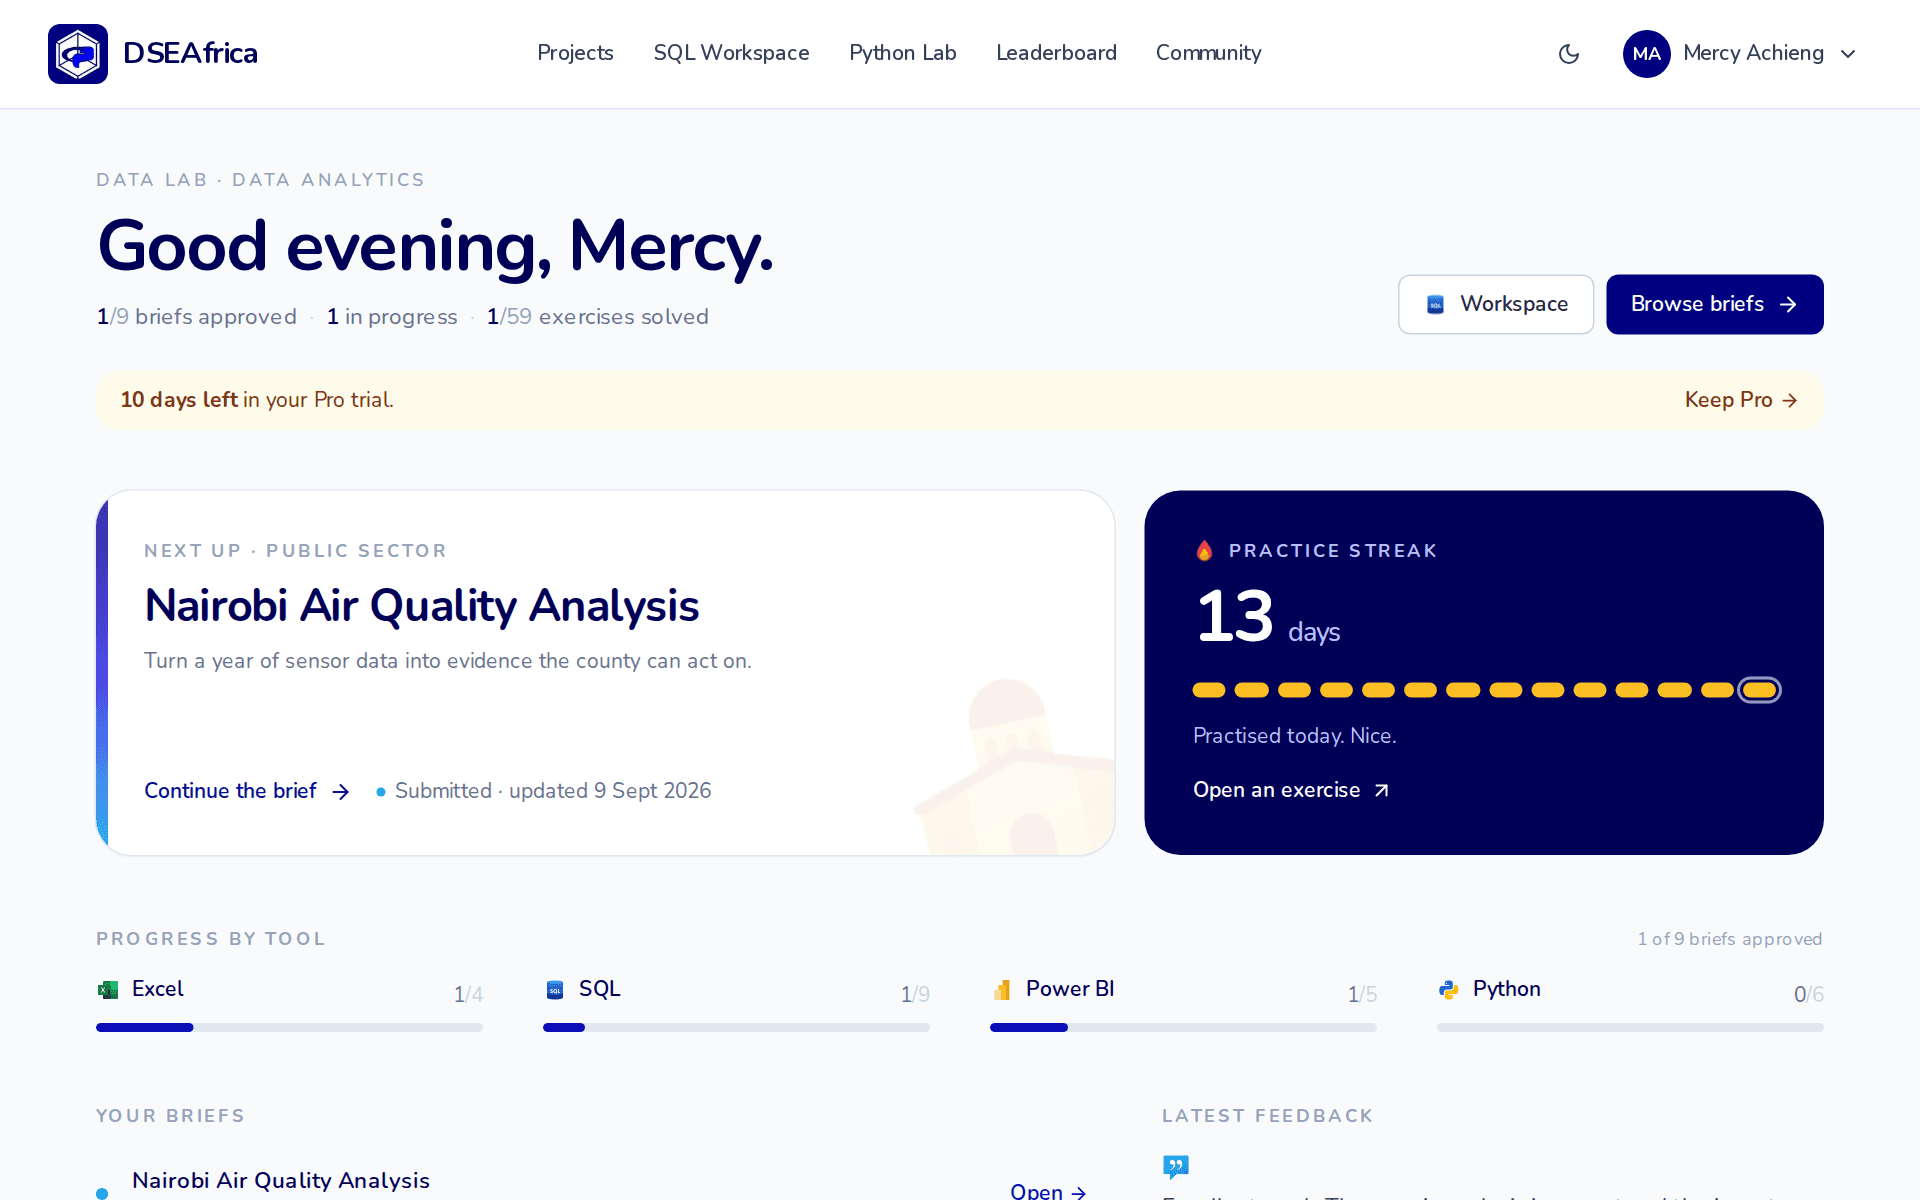
During your trial the dashboard also shows how many days of Pro remain. See Plans and billing.
Chapter 3
Projects and briefs
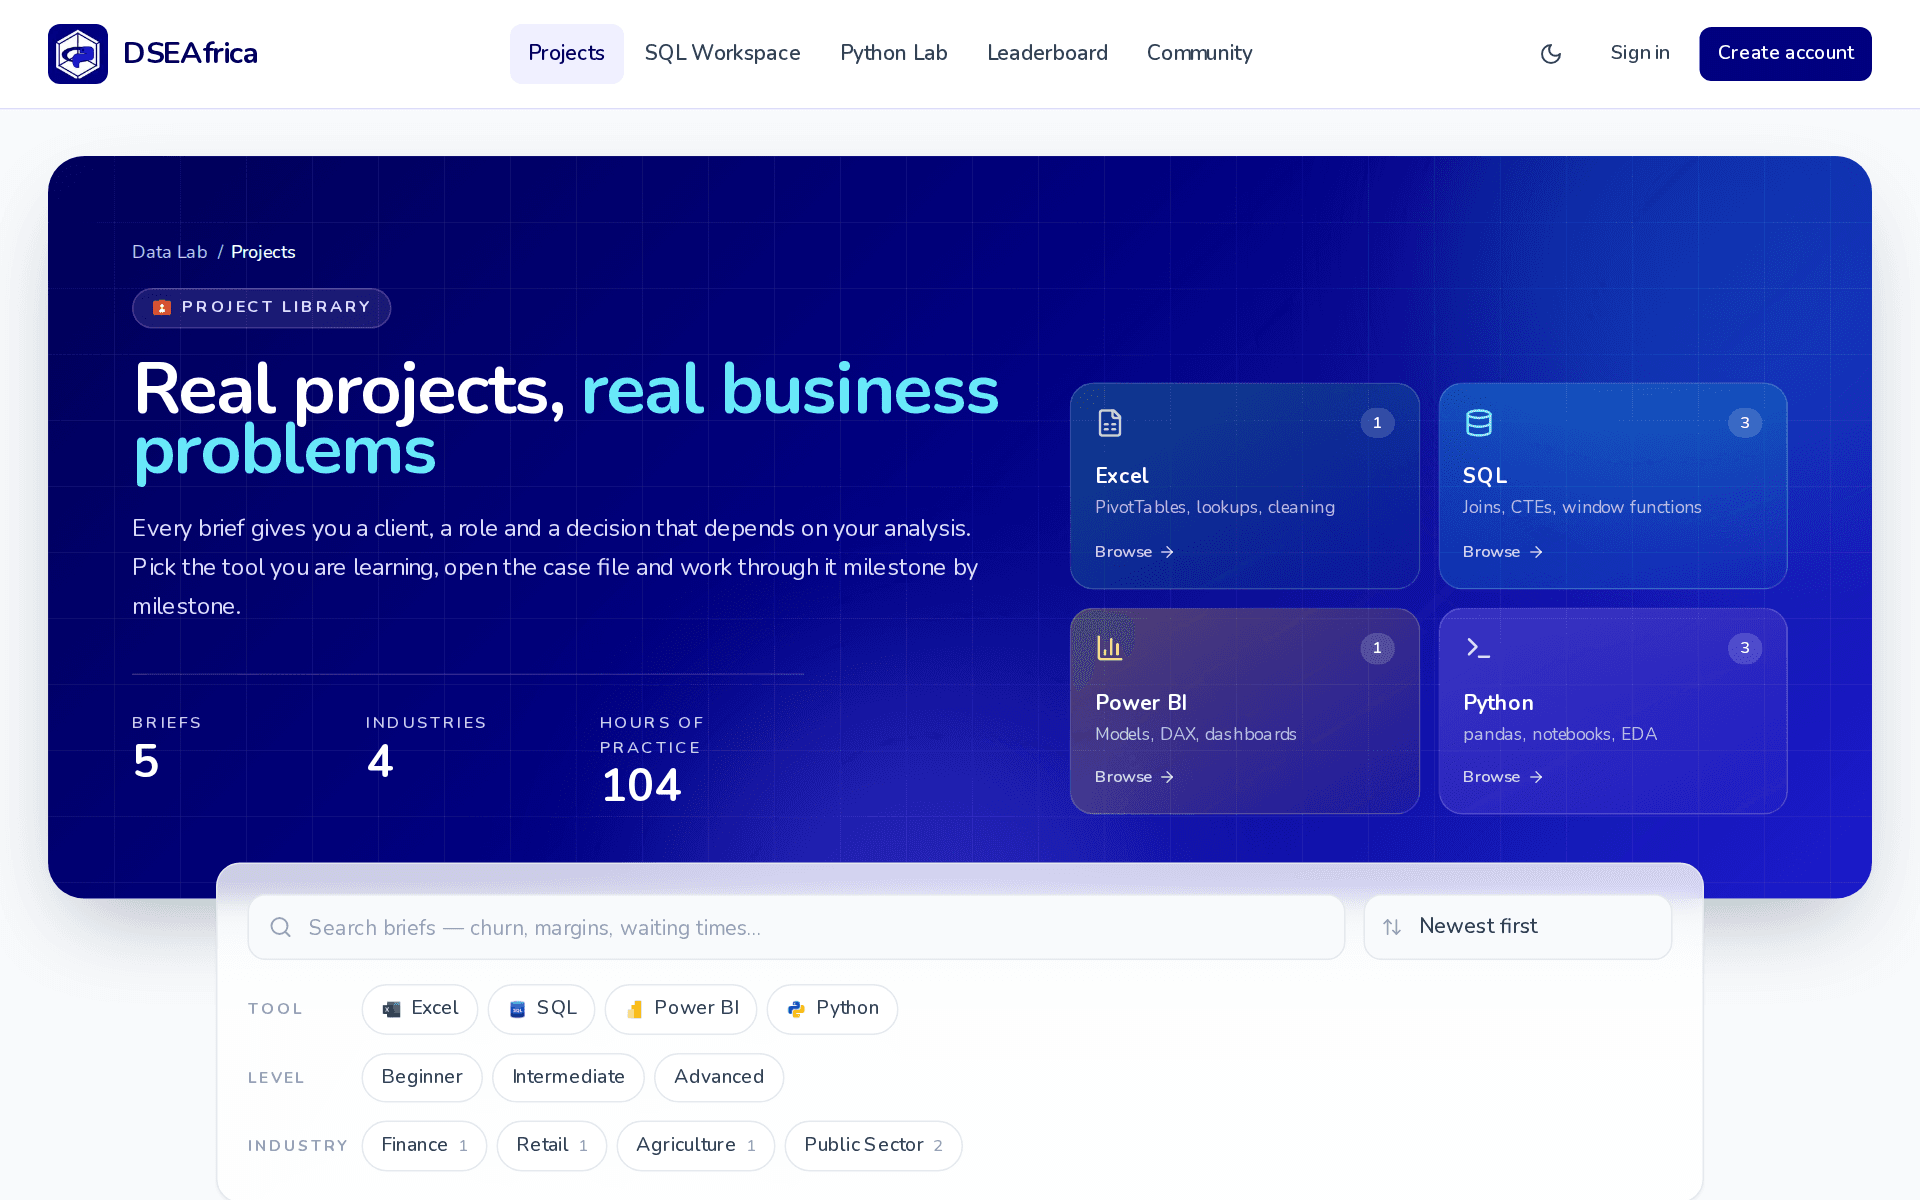
The project library is the heart of the platform. Every project is a brief in the sense a consultant would recognise: a client, a role, a decision, and data that is not quite clean.
Finding a project
Use the chips at the top of the library to filter by tool, difficulty or industry, or open the featured brief. Beginner briefs assume only basic familiarity with the tool. Advanced briefs expect you to make and defend modelling decisions.
What a brief contains
- Client and role. Who you work for and the seat you are sitting in.
- Business problem. The decision your analysis has to support.
- Data dictionary. Every column explained, including columns with missing or malformed values. Those are deliberate and part of the exercise.
- Milestones. A sequence of business questions that build on each other, so you always know the next step.
- Deliverables. Exactly what to hand in: a workbook, a Power BI file, a notebook, a script, a PDF, screenshots or a repository link.
- Rubric. The weighted criteria a mentor will score, published before you start.
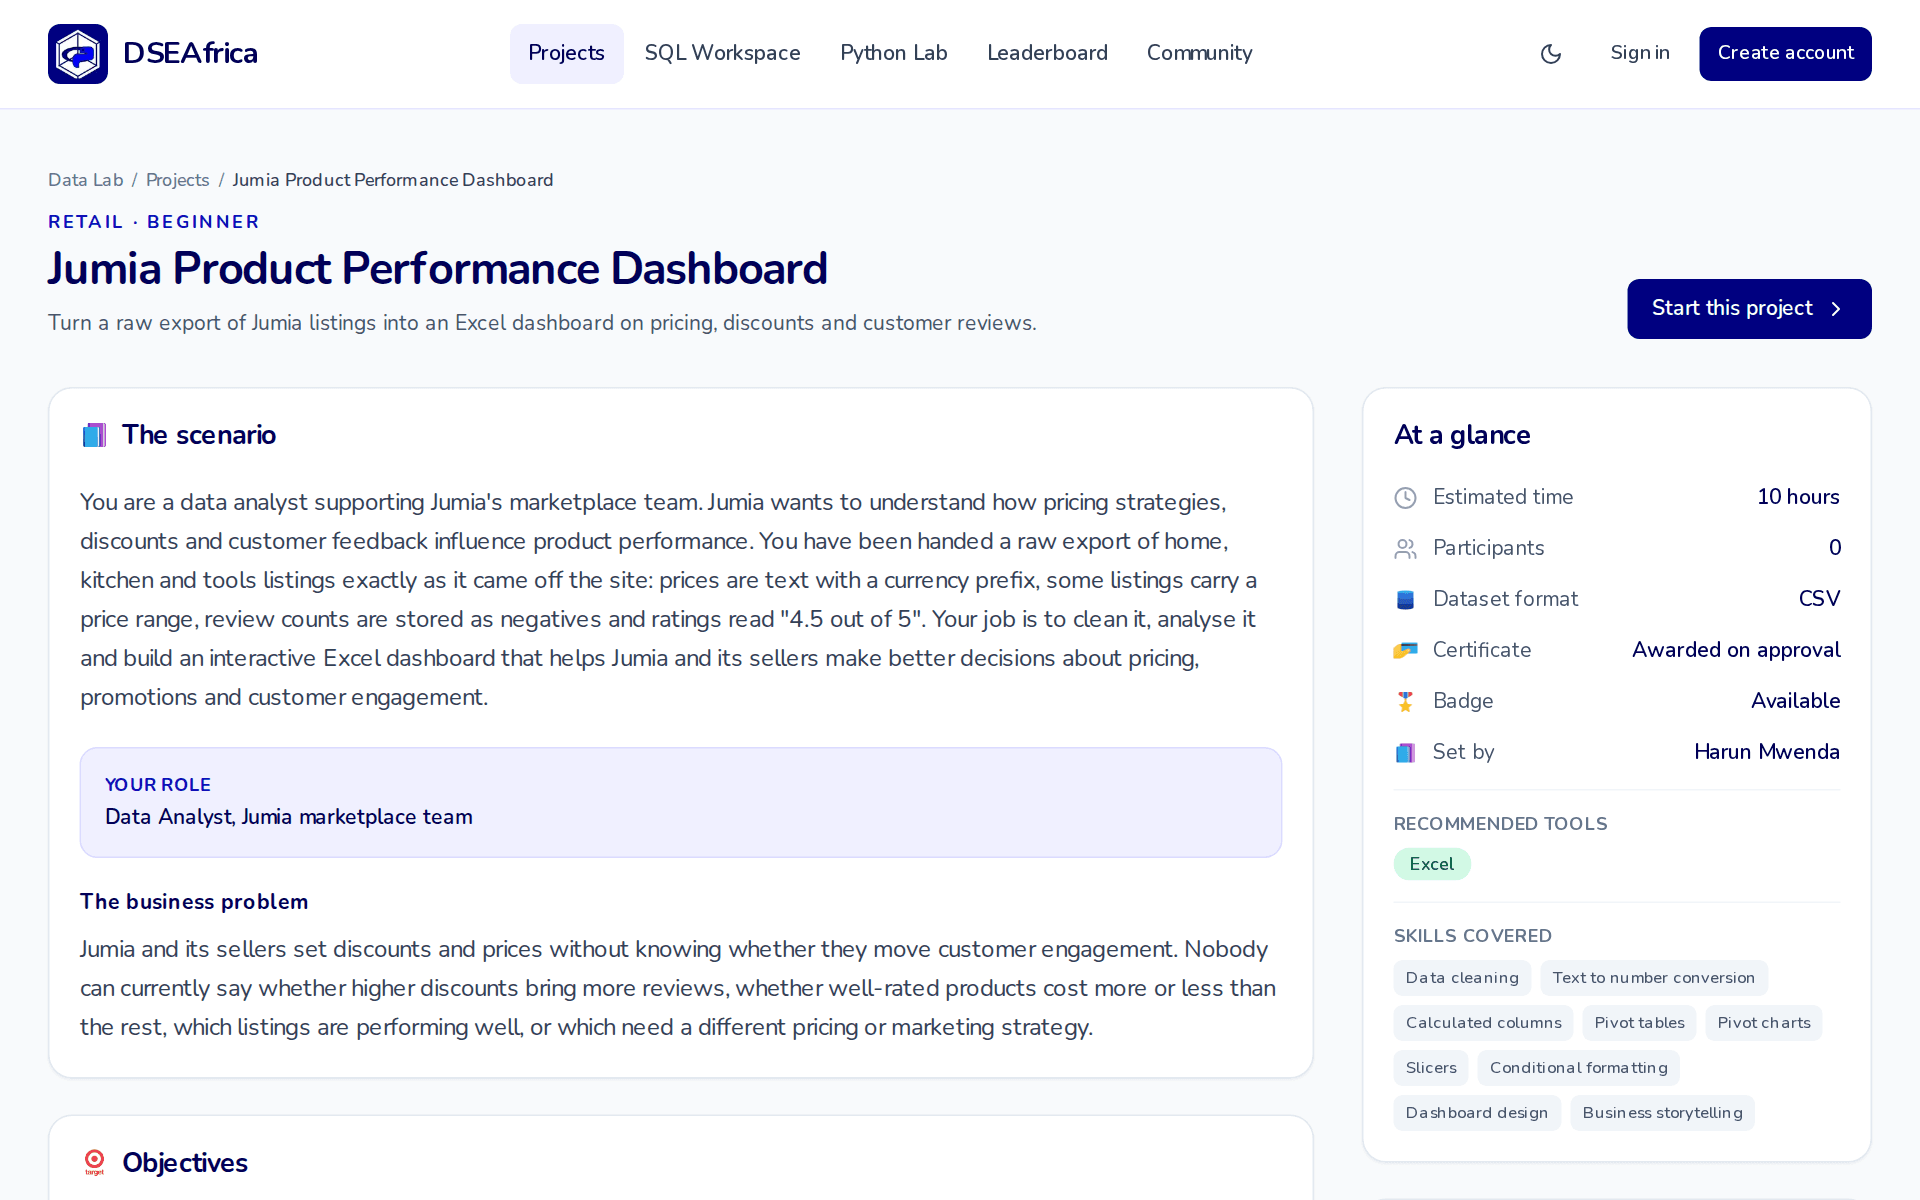
Read the rubric first. It shows what a strong submission looks like and stops you spending hours on something worth two percent of the mark.
Getting the data
Every dataset can be downloaded from the brief for use in Excel, Power BI or Python. For SQL, open the brief in the workspace and the tables are already loaded.
Chapter 4
The SQL workspace
The workspace runs a complete database engine inside your browser. Nothing is installed and your data does not leave your machine unless you connect to an external database. It needs a current version of Chrome, Edge, Firefox or Safari.
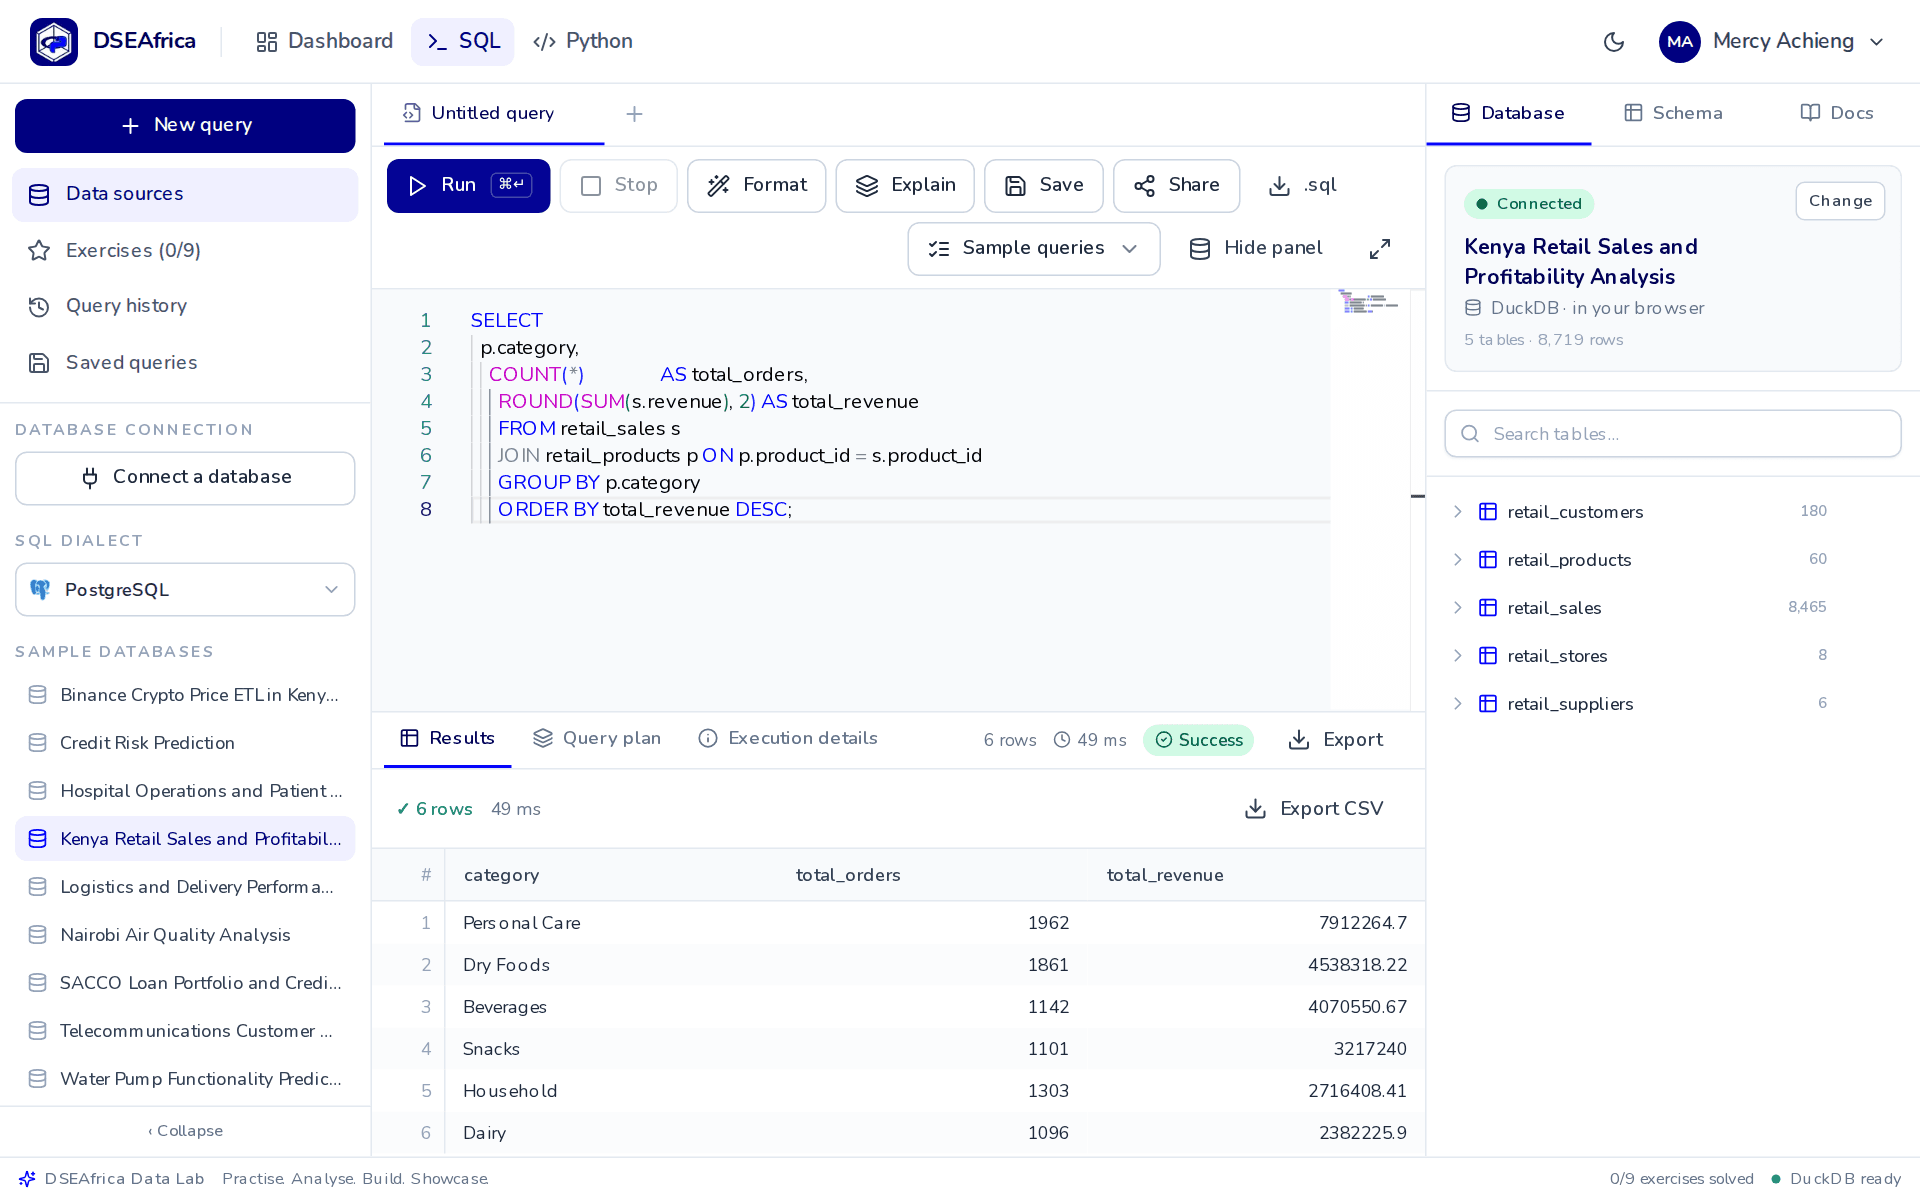
Layout
- Left panel. Data sources, exercises, query history and saved queries, the connect-a-database control, the dialect picker and the list of sample databases.
- Editor. Tabs for several queries at once. Double-click a tab to rename it. Auto-completion knows your tables and columns. The toolbar has Run, Stop, Format, Explain, Save, Share, a download as .sql, and sample queries for the open project.
- Bottom panel. Results with row count and timing, the query plan, execution details, and any error. Export results to CSV from the results toolbar.
- Right panel. The connected database with its tables and row counts, a schema browser that lists columns and types, and the project docs.
Running queries
Press Ctrl + Enter (Cmd + Enter on a Mac) or Shift + Enter to run the query. A running query can be stopped from the toolbar.
Your own files
Drop CSV, Excel, JSON or Parquet files onto the workspace or use the add-file control in the left panel. Each file becomes a table you can query and join with project data. Files stay in your browser.
History and saved scripts
Every query you run is kept in history. Save a query with a name to keep it permanently; saved scripts are tied to your account and follow you between devices. Delete them from the same list.
Dialects
The dialect picker in the toolbar rewrites your query into PostgreSQL, MySQL, MariaDB, SQL Server, Oracle, SQLite, Snowflake, BigQuery or Redshift syntax. Use it to see how date handling, string functions and limits differ between engines, which is exactly what interviewers ask about.
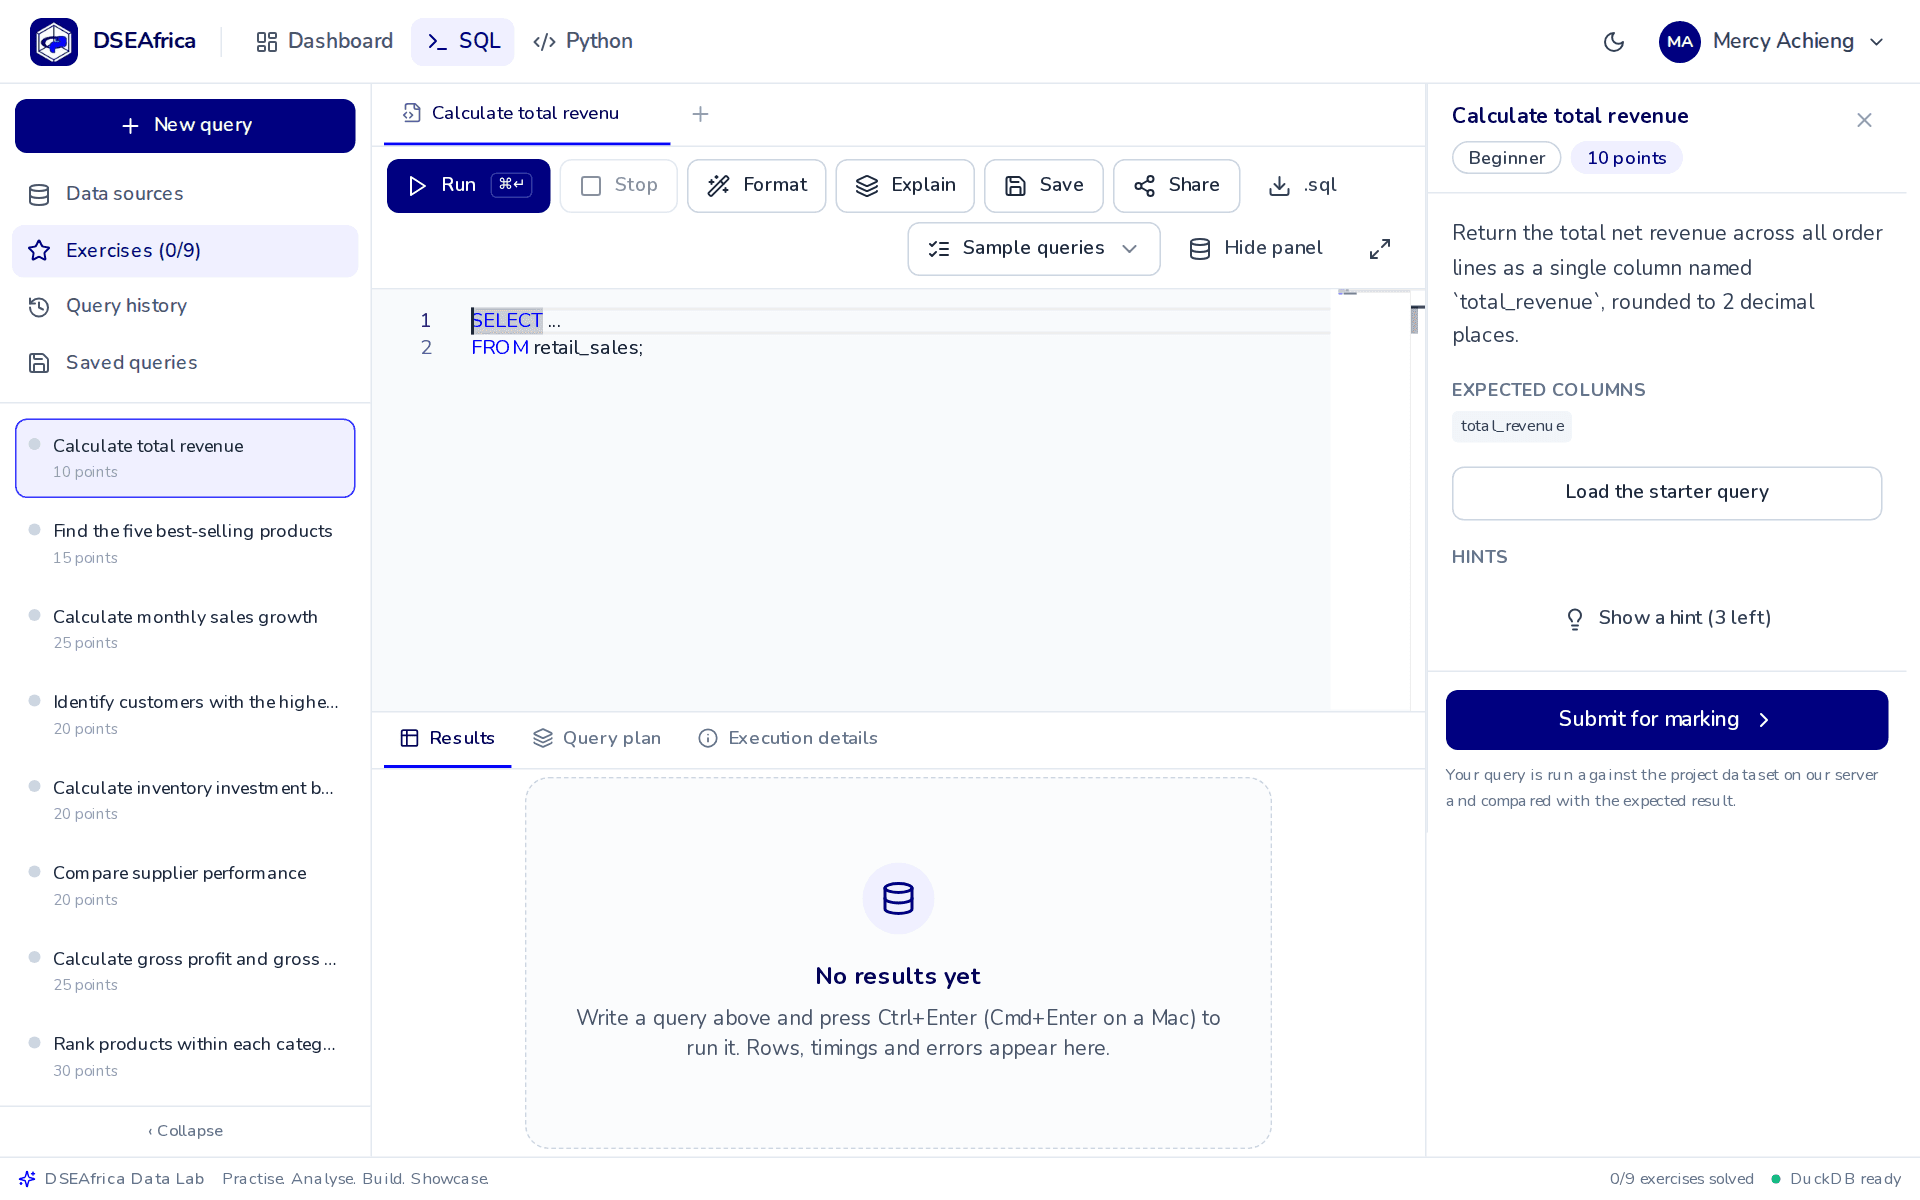
Graded exercises
Where a project includes exercises, the right panel shows the question and the expected columns. Write your query, run it to check the shape of the result, then click Submit for marking. Marking happens on the server against reference data, so a pass means the query is actually correct. Feedback says what is wrong without giving away the answer, and hints unlock one at a time. Each pass counts toward your streak.
Connect your own database
Click Connect in the toolbar to point the editor at your own PostgreSQL, MySQL, MariaDB, SQL Server or Redshift database. Enter a connection string or fill in host, port, database, username and password. The connection is read-only, credentials are kept only in your browser session, and the server relays queries without storing them. This feature needs Pro after the trial. Databases on private or local network addresses cannot be reached from the platform.
Chapter 5
The Python lab
The Python lab is a notebook that runs in your browser. Python 3.12 with pandas, NumPy, Matplotlib, SciPy and scikit-learn loads the first time you open it, about 30 MB, and is cached after that. Pick a project and its datasets are placed in data/, so pd.read_csv("data/credit_loans.csv") just works.
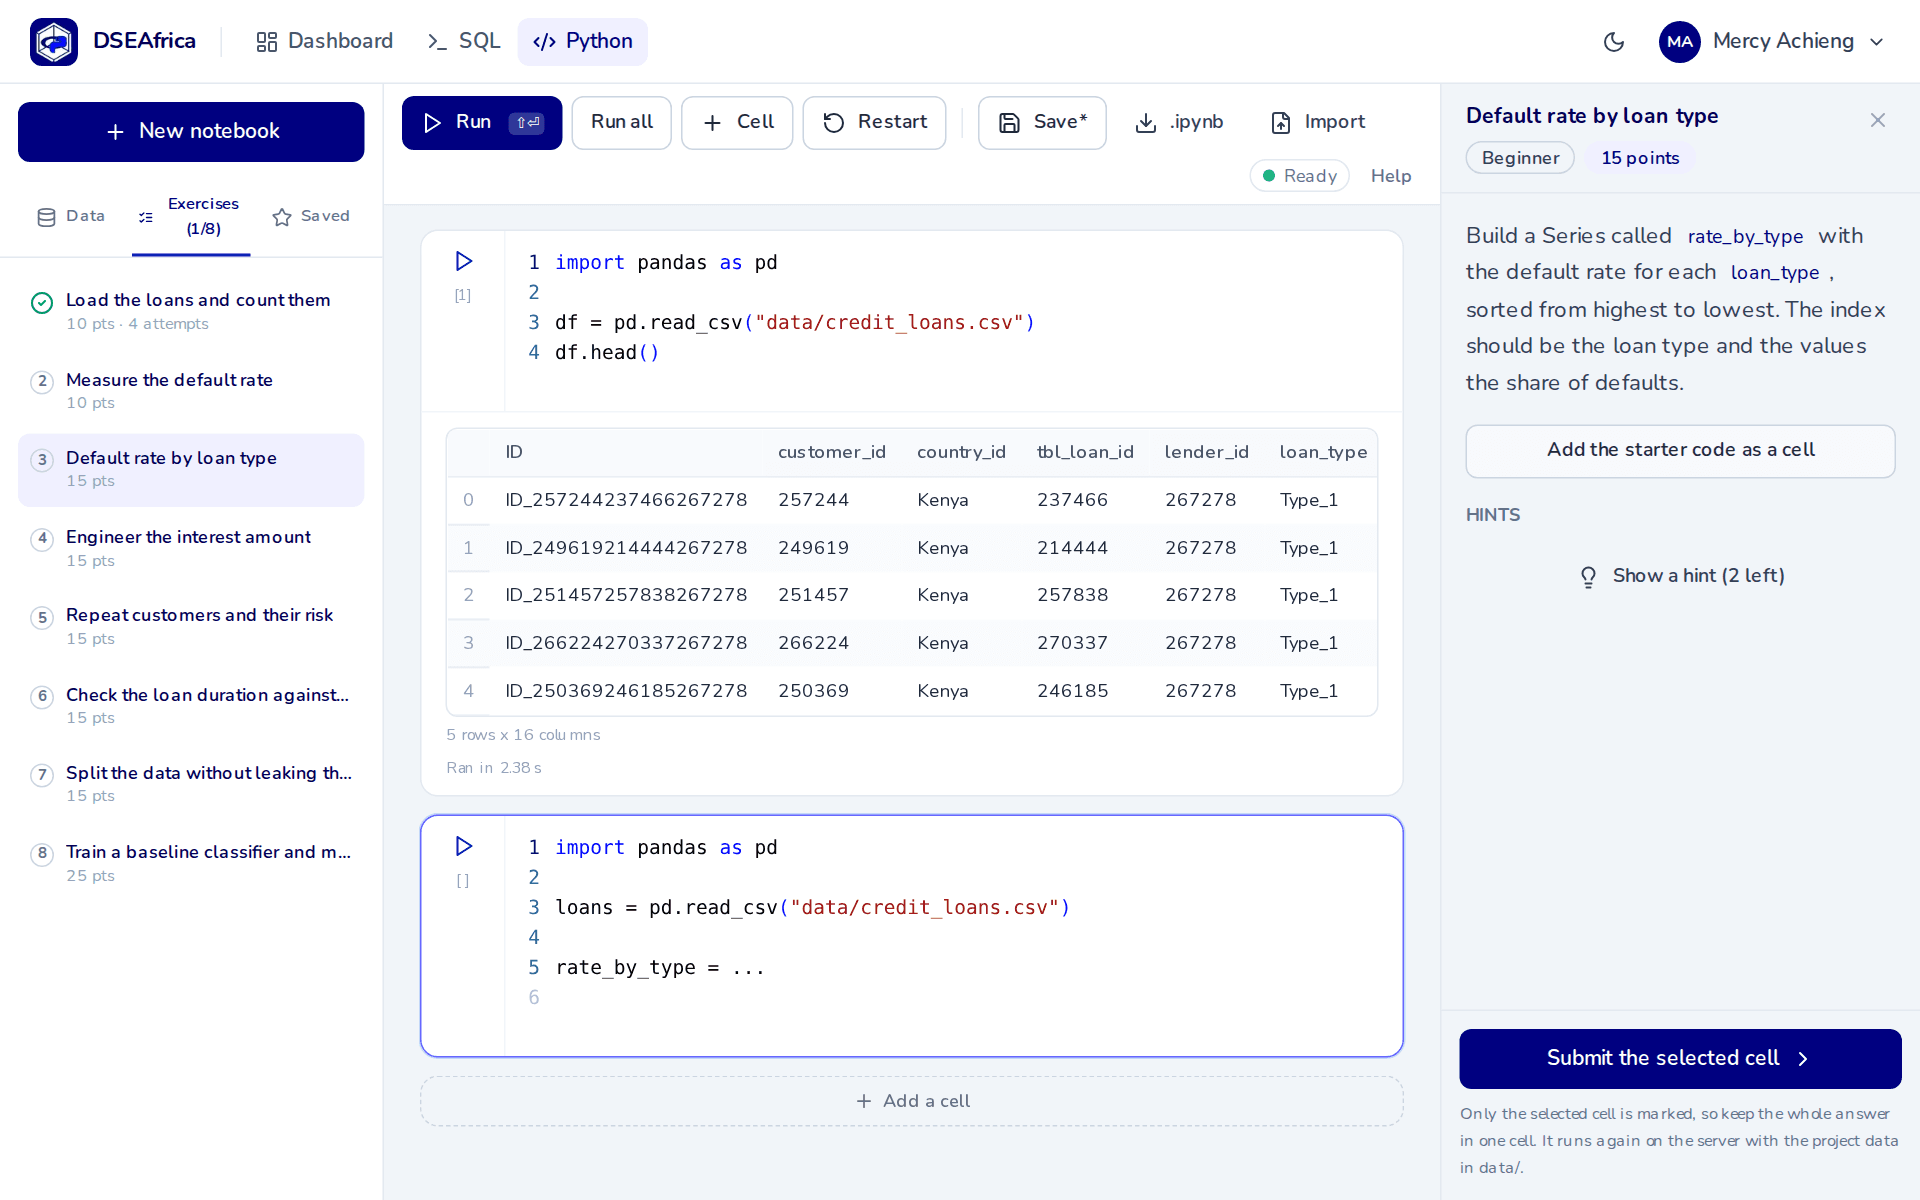
Cells
- Shift + Enter runs a cell and moves to the next one; Ctrl + Enter runs it in place. Variables persist between cells.
- The last expression in a cell is displayed, as in Jupyter. End with
df.head()to see a table. Matplotlib charts appear under the cell automatically. - Hover a cell for move, insert and delete. Restart clears every variable and reloads the datasets.
Notebooks
Your work is kept in the browser as you type. Save stores the notebook on your account so it follows you between devices, and the Saved tab lists them. .ipynb downloads a Jupyter notebook with outputs, which you can attach to a submission, and Import opens one you already have.
Graded exercises
Projects with Python exercises list them in the Exercises tab. Each asks you to leave a named variable or DataFrame behind. Write the answer in one cell, select it, and click Submit the selected cell. The code runs again on the server with the same data, so the marker cannot be fooled by editing outputs, and the feedback tells you what is wrong without giving the answer. Passed exercises earn points and count toward your streak, exactly like SQL.
Limits
Memory is your browser's, so very large joins can fail. Code has no network access and input() is disabled. XGBoost and LightGBM have no browser builds; use scikit-learn. Anything that needs Docker or Airflow, such as the data engineering brief, still runs on your own machine.
Chapter 6
Excel, Power BI and Python
Not everything happens in SQL. Three practice pages gather the projects for each tool and explain what each one exercises.
- Excel: PivotTables, XLOOKUP, cleaning and one-page dashboards.
- Power BI: star schemas, DAX measures, time intelligence and storytelling.
- Python: pandas, notebooks and scripts, up to full machine learning and data engineering briefs, with the in-browser Python lab for practice.
A sensible order for someone starting out is Excel, then SQL, then Power BI, then Python. Each stage reuses what the previous one taught.
Chapter 7
Submitting work
When a brief is finished, open Submit from its page. The form lists the deliverables the brief asked for so you can check nothing is missing.
- Attach files. Workbooks, Power BI files, notebooks, scripts, PDFs and screenshots are all accepted. Remove a file with the bin icon if you attached the wrong one.
- Add links. A GitHub repository, a published Power BI Service report, or any other link. Give each a short label.
- Write a note. Tell the mentor what you did and any assumptions you made. A short, honest note about what you found hard earns better feedback.
- Save a draft to come back later, or Send to put it in the review queue.
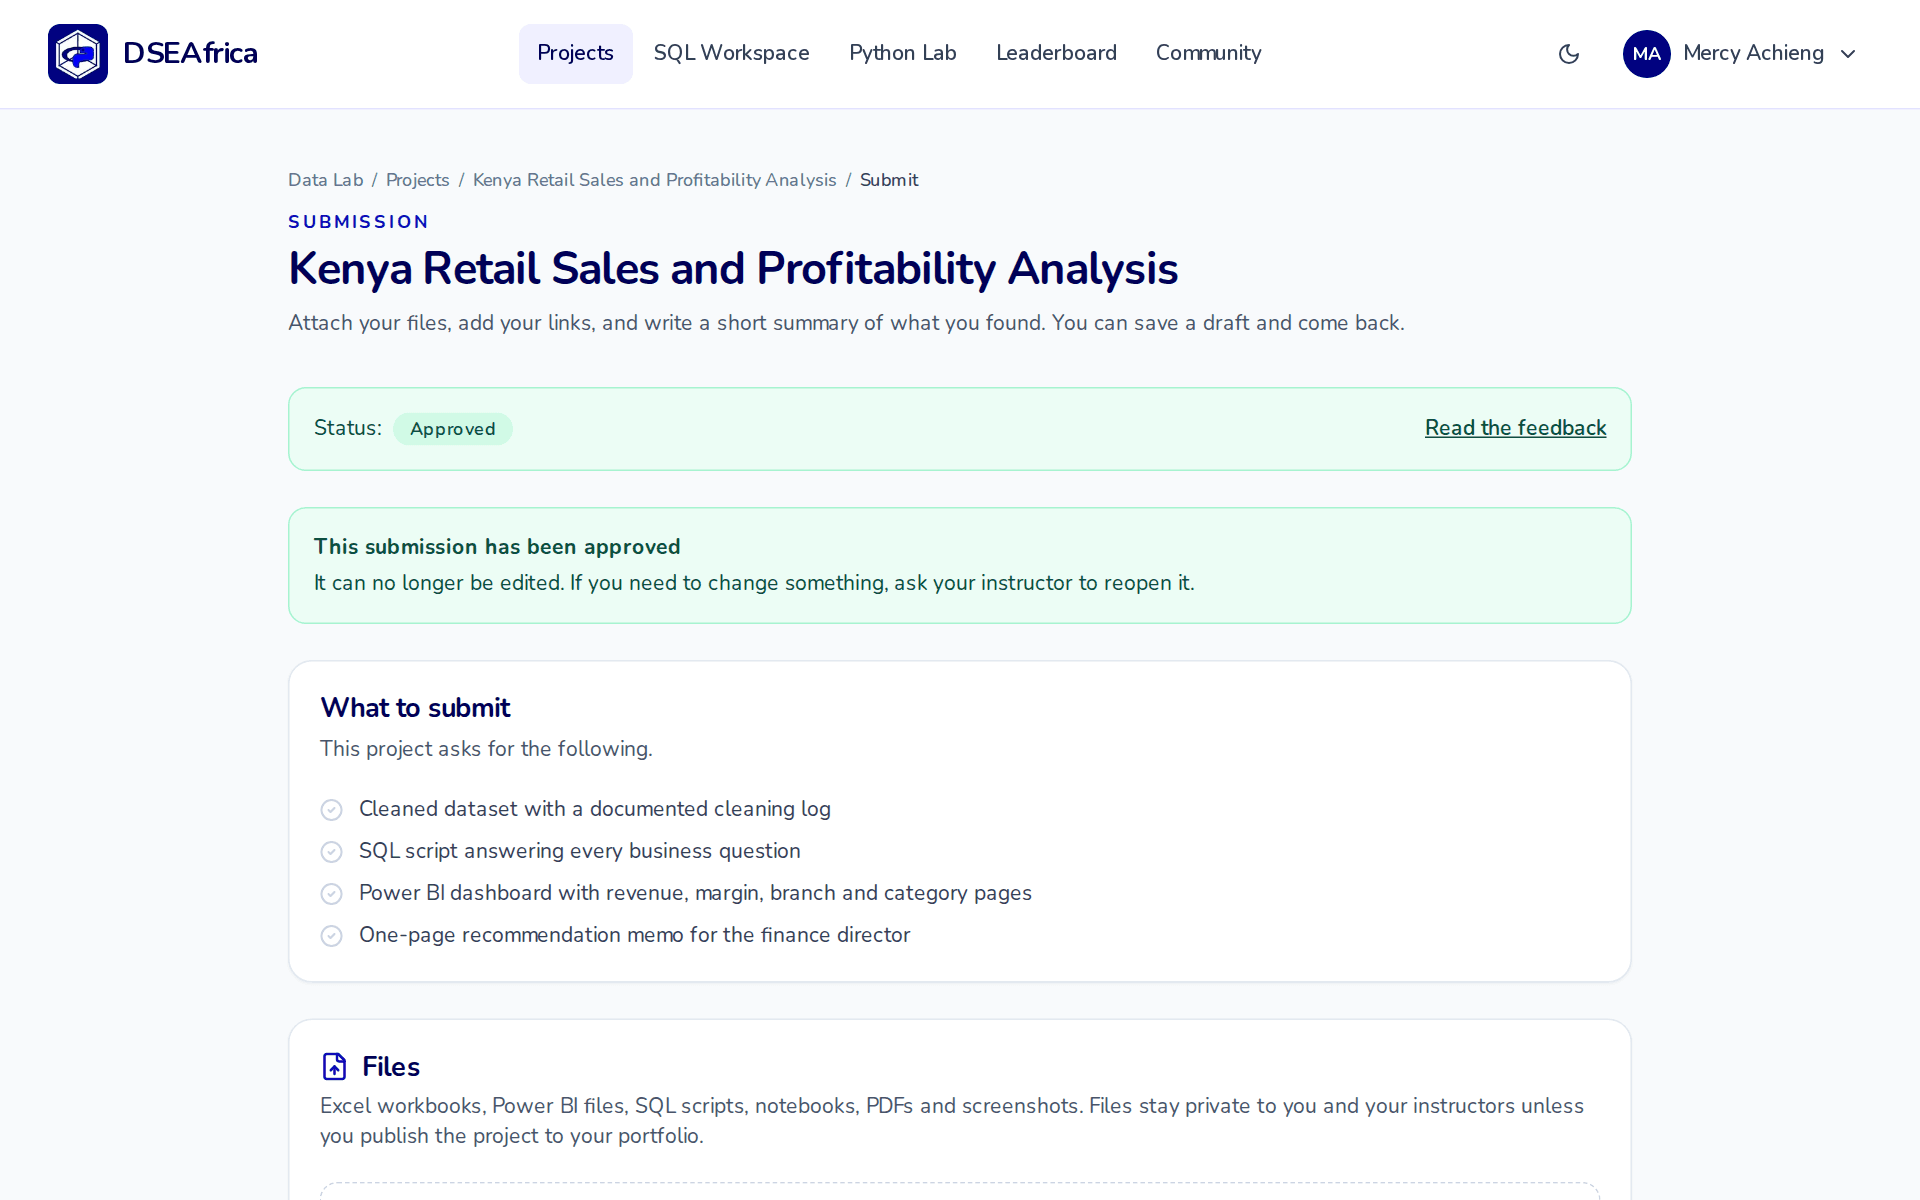
Uploaded files count against the storage allowance shown in Settings under Files and storage. Files attached to a marked submission are locked so the record of what was assessed stays intact.
Chapter 8
Marking and feedback
A mentor scores each rubric criterion, writes a comment against it, and returns one of three decisions. You are notified, and the full breakdown is on the project's Feedback page.
- Pass. The work meets the bar and becomes eligible for your portfolio.
- Revise. Close, with something specific to fix. Read the comments, update your files, and submit again from the same page.
- Fail. Rare, and always with written reasons. You can attempt the brief again.
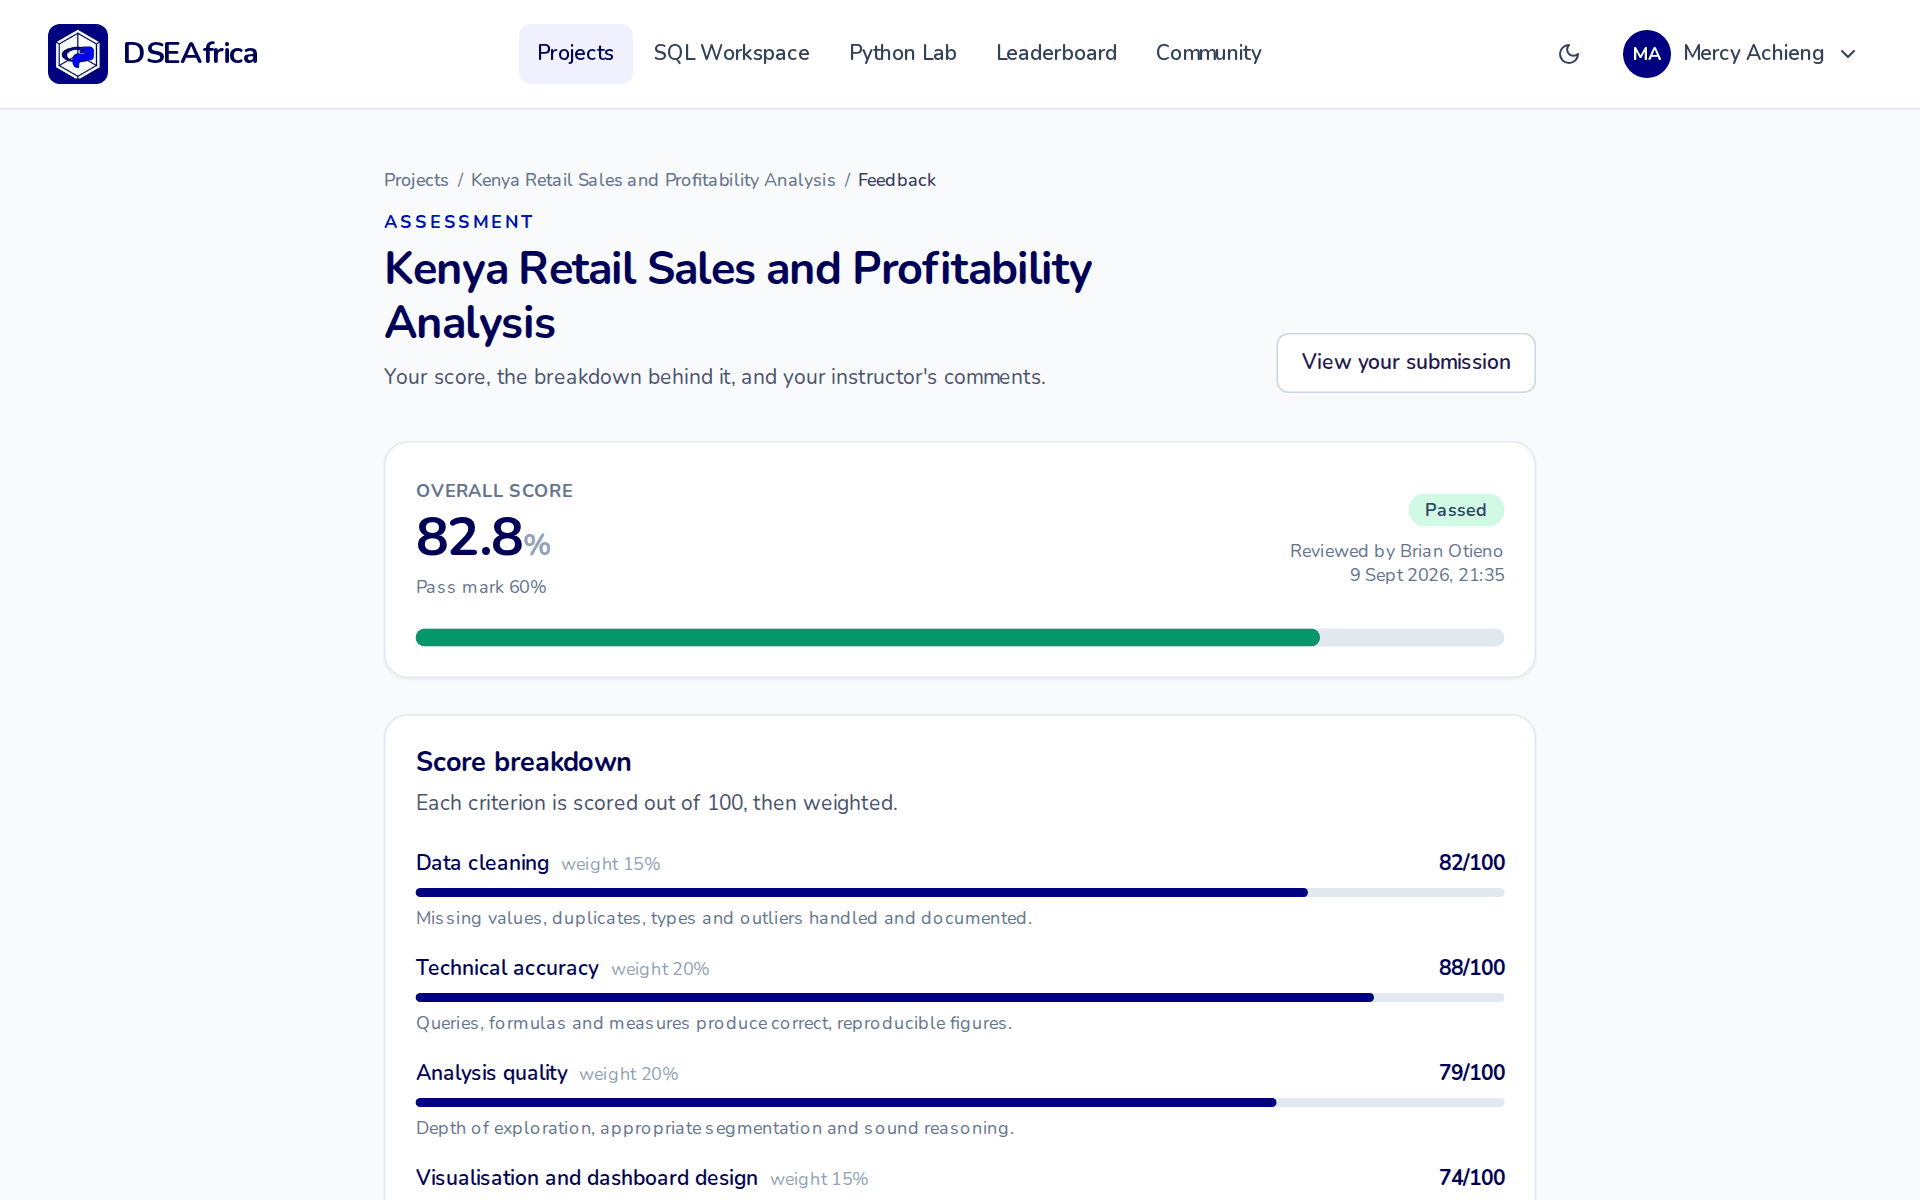
Scores are weighted by the rubric, so the total you see is the same total the mentor saw while marking.
Chapter 9
The community board
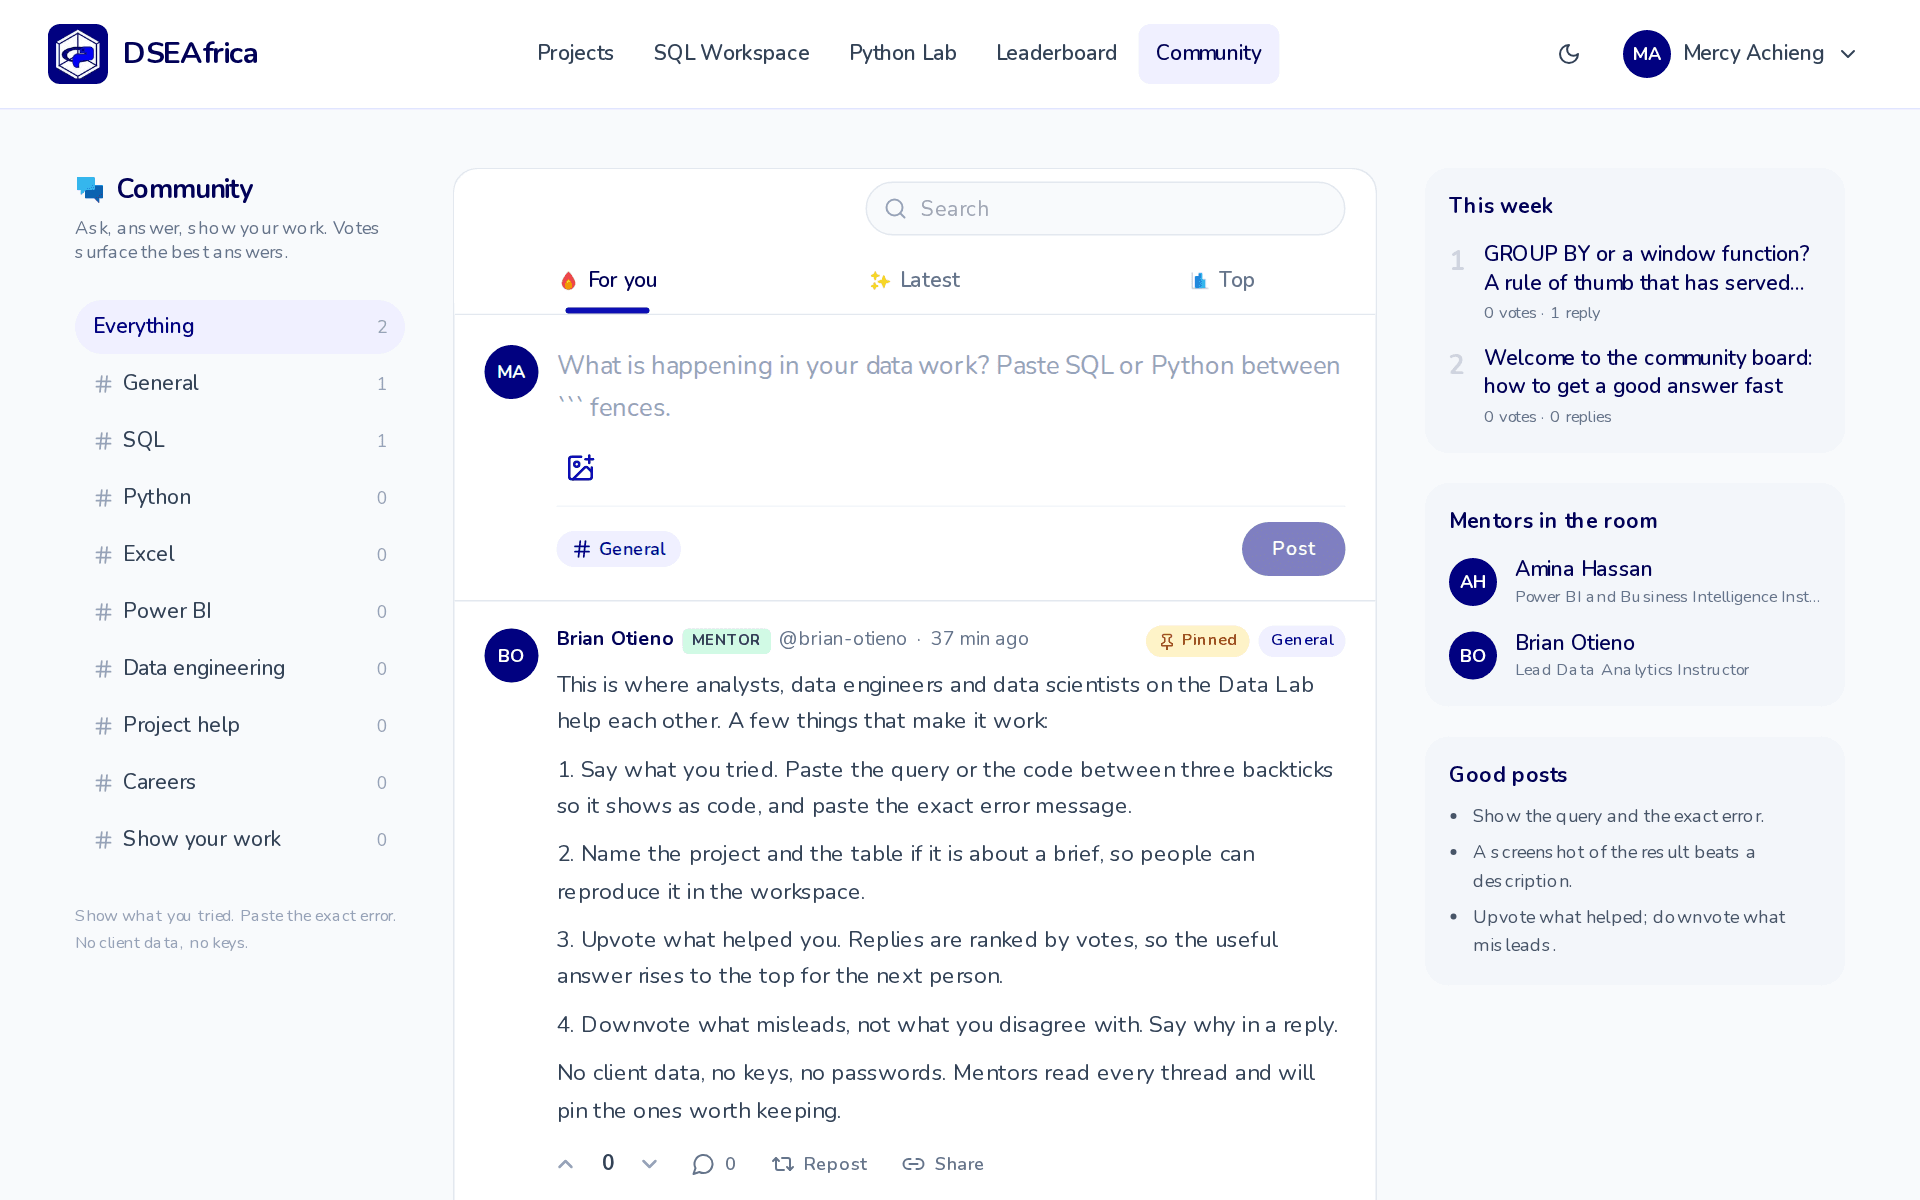
The community board is where learners and mentors ask, answer and show work. It is organised into topics: General, SQL, Python, Excel, Power BI, Data engineering, Project help, Careers and Show your work.
Posting
- Write in the composer at the top of the feed and pick a topic. The first line becomes the title.
- Wrap SQL or Python in triple backticks (
```) and it renders as a code block. Single backticks give inline code. Links become clickable. - Attach up to four photos to a post and two to a reply. A screenshot of the error or the dashboard is usually the most useful thing you can add.
- Never post client data, personal data or API keys.
Replies and votes
Reply to a post, or reply to a reply to keep a side discussion together. Upvote what helped and downvote what misleads. The highest-voted reply on a thread is shown first and marked as the top answer.
Reposting
Click the repost icon on any post to share it to the feed under your name. It appears with a “reposted” line and full credit to the original author, and votes and replies still belong to the original. Click again to undo. You cannot repost your own post.
Deleting
You can delete your own posts, reposts and replies at any time from the feed or from inside the thread. Deleting a post removes its replies as well. Mentors and administrators can delete anything, and can pin a thread to the top or lock it to stop further replies.
Feeds
For you ranks by recent activity and votes, Latest is newest first, and Top is by score. The search box looks through titles and bodies. The right column shows the week's most active threads and the mentors currently taking part.
Chapter 10
Your portfolio
Every passed project can be published to a public page at your own handle, for example /portfolio/your-handle. It shows the brief, your deliverables, your dashboards and repositories, and the mentor's rubric score.
- Choose project by project what is public. Anything you would rather not show stays private.
- Set the whole page to Public or Private under Settings, Portfolio. While private, only you and your mentors can see it.
- Add a short bio and a photo under Settings, Profile. Both appear on the page, and the photo shows next to your posts on the board.
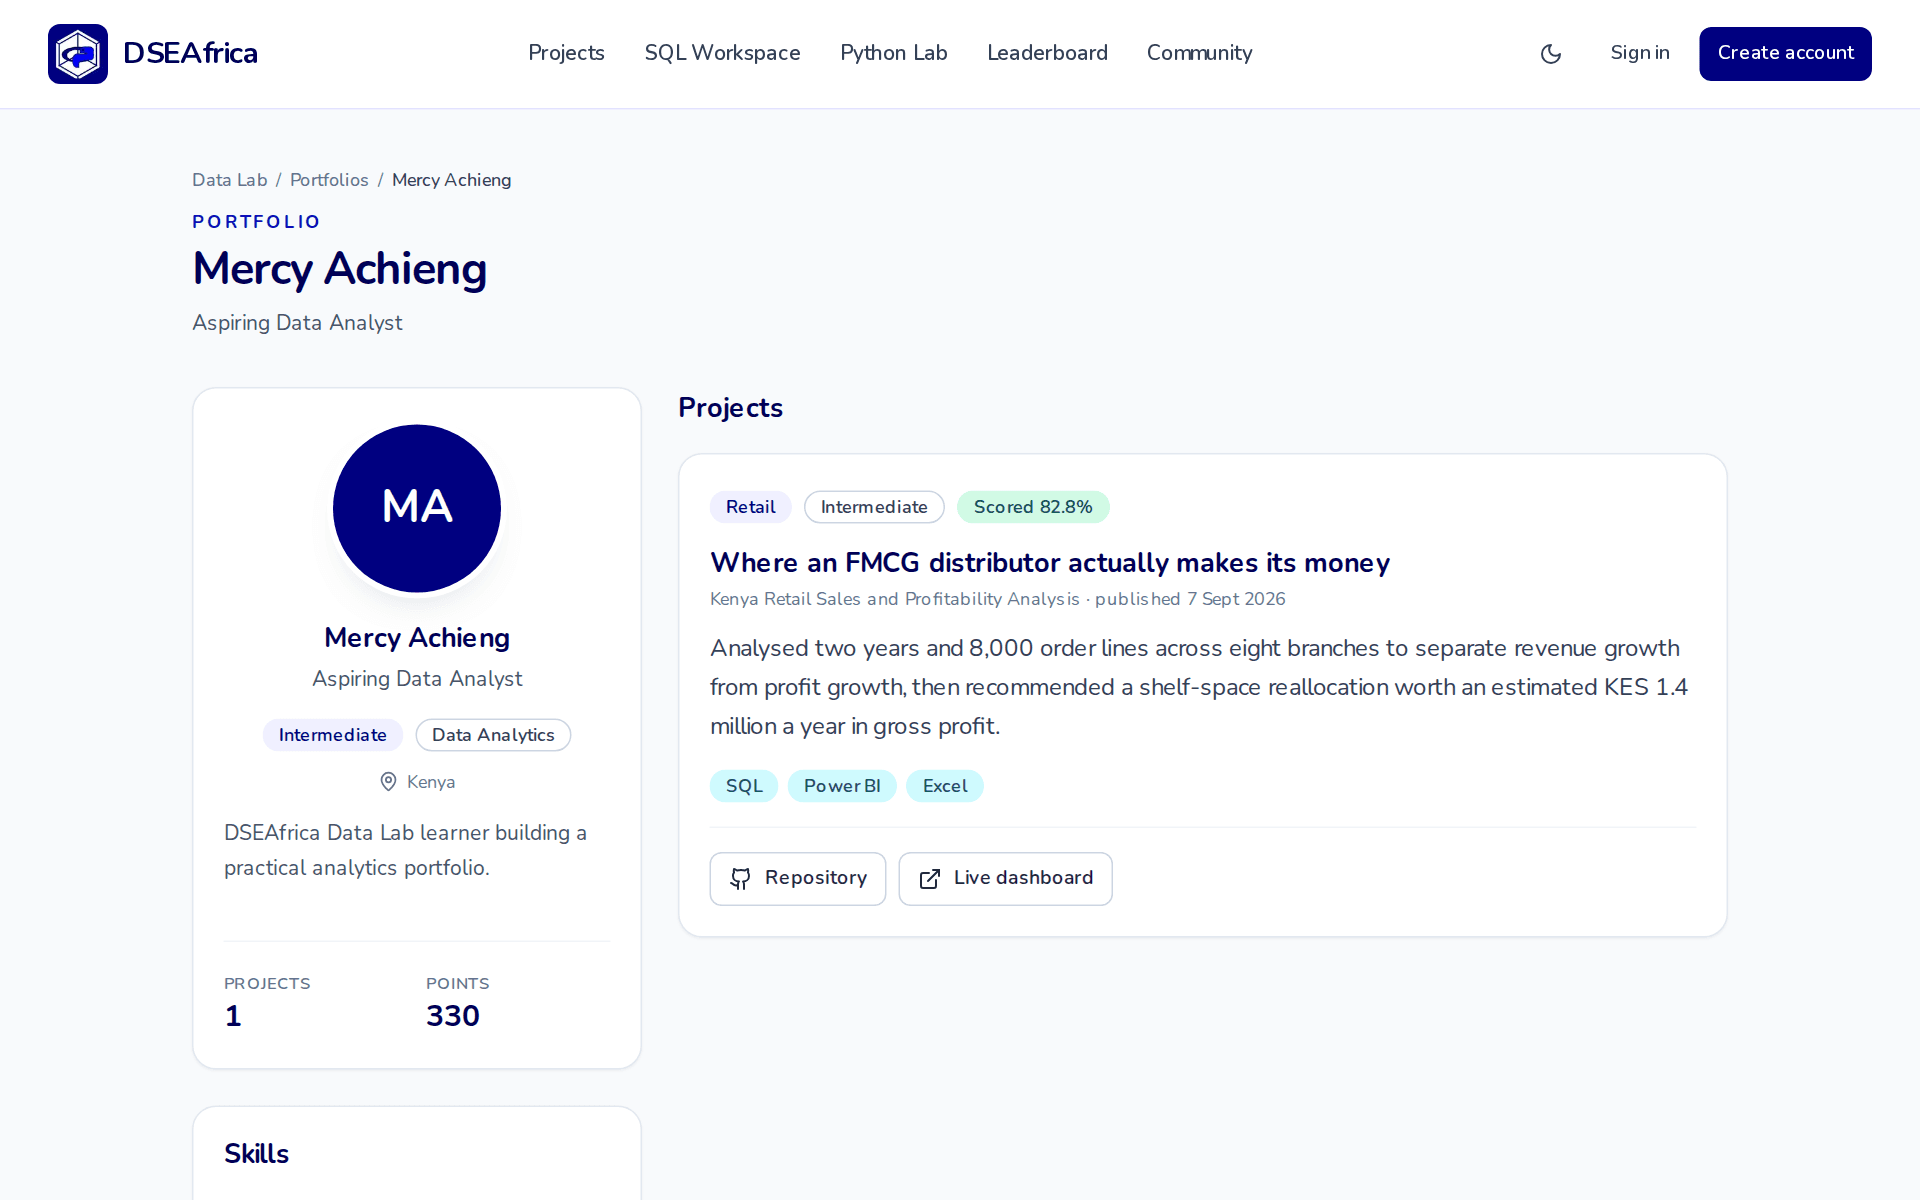
When you apply for a role, send the portfolio link. A case study with a client, a decision and a marked rubric says more than a certificate of completion.
Chapter 11
Leaderboard, streaks and badges
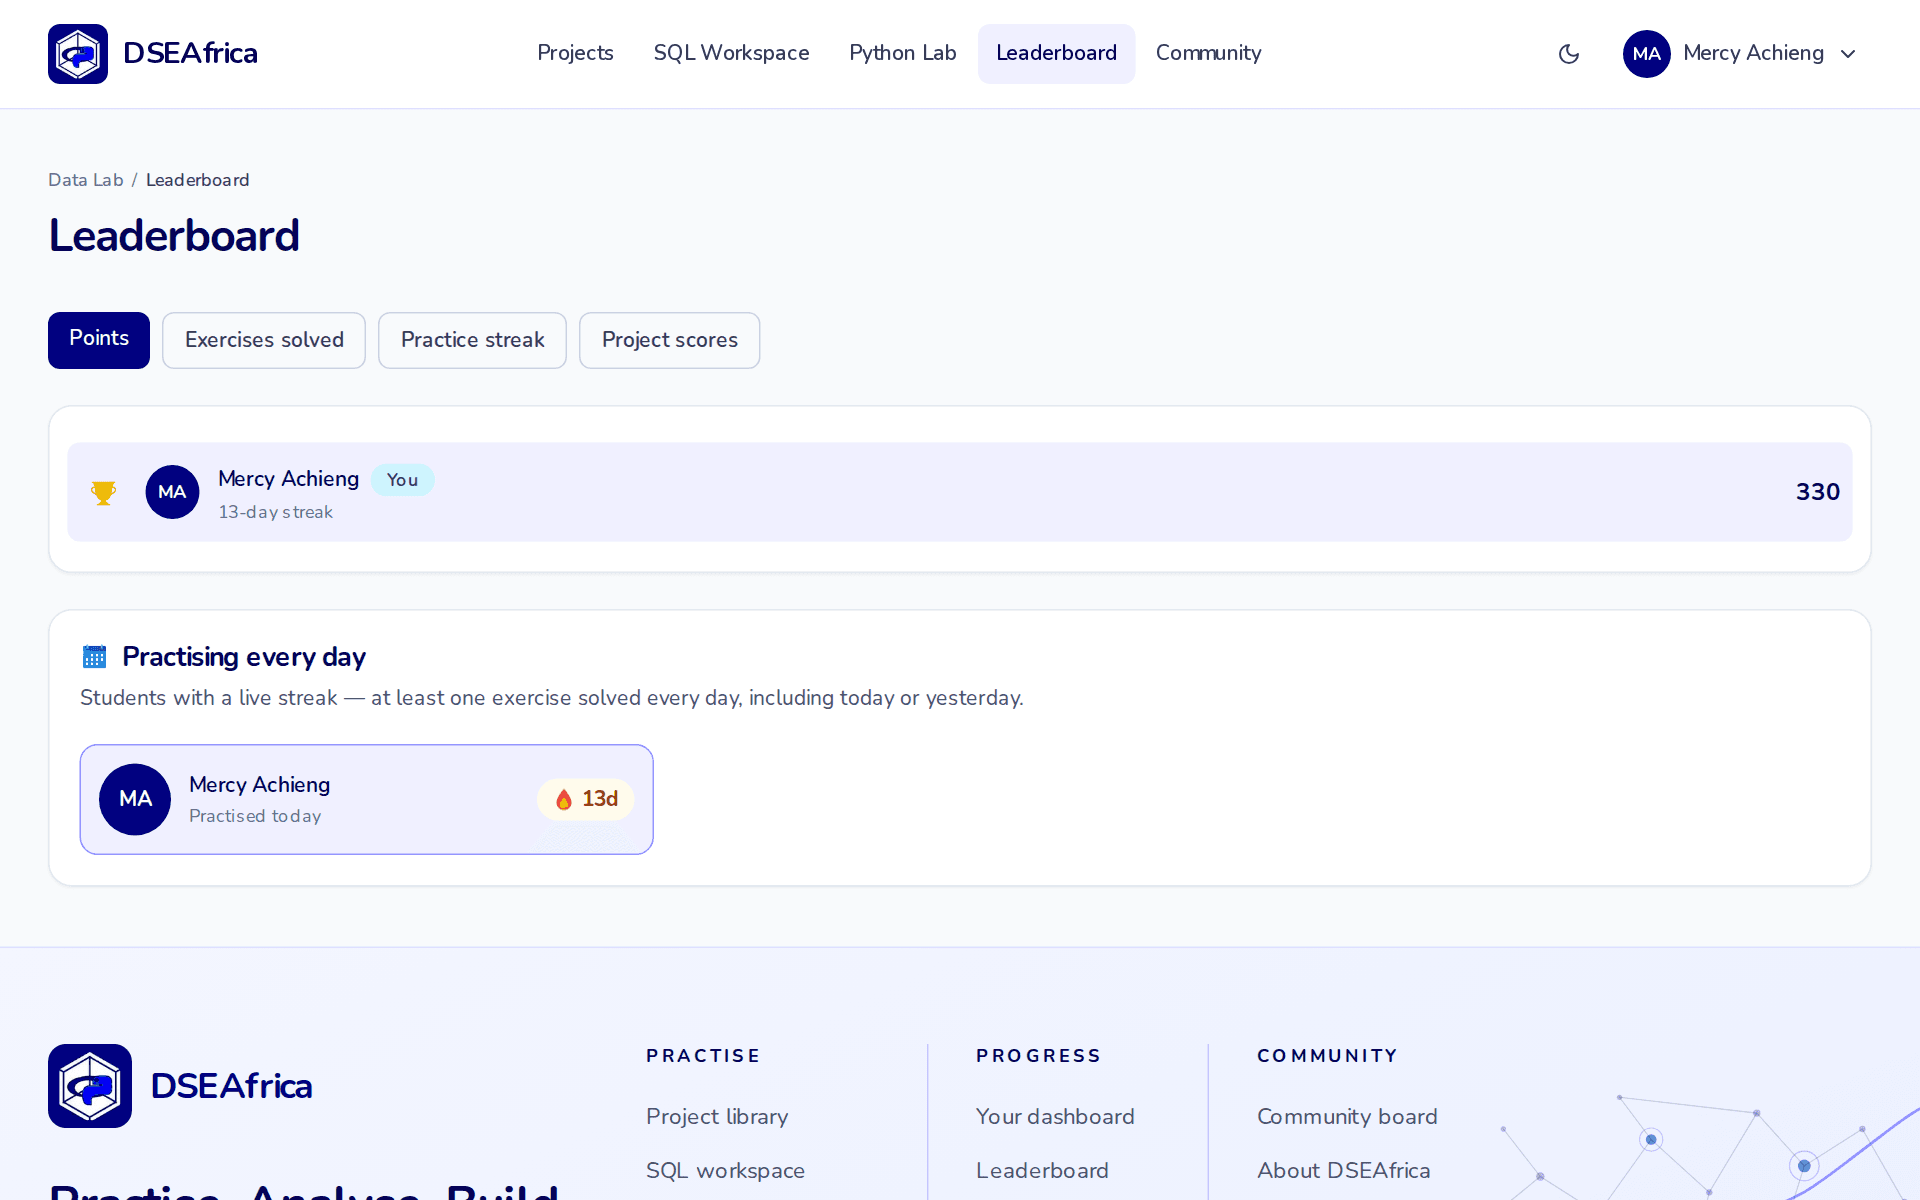
The leaderboard ranks learners by points earned from graded SQL exercises, and also shows distinct exercises solved, practice streaks and the average score across approved project submissions. Streaks count consecutive days with at least one solved exercise. Badges such as SQL Joins Champion, Window Functions Master and Power BI Storyteller are awarded for demonstrated work, never for time spent on the site, and appear on your portfolio.
Chapter 12
Account settings
Settings has four tabs.
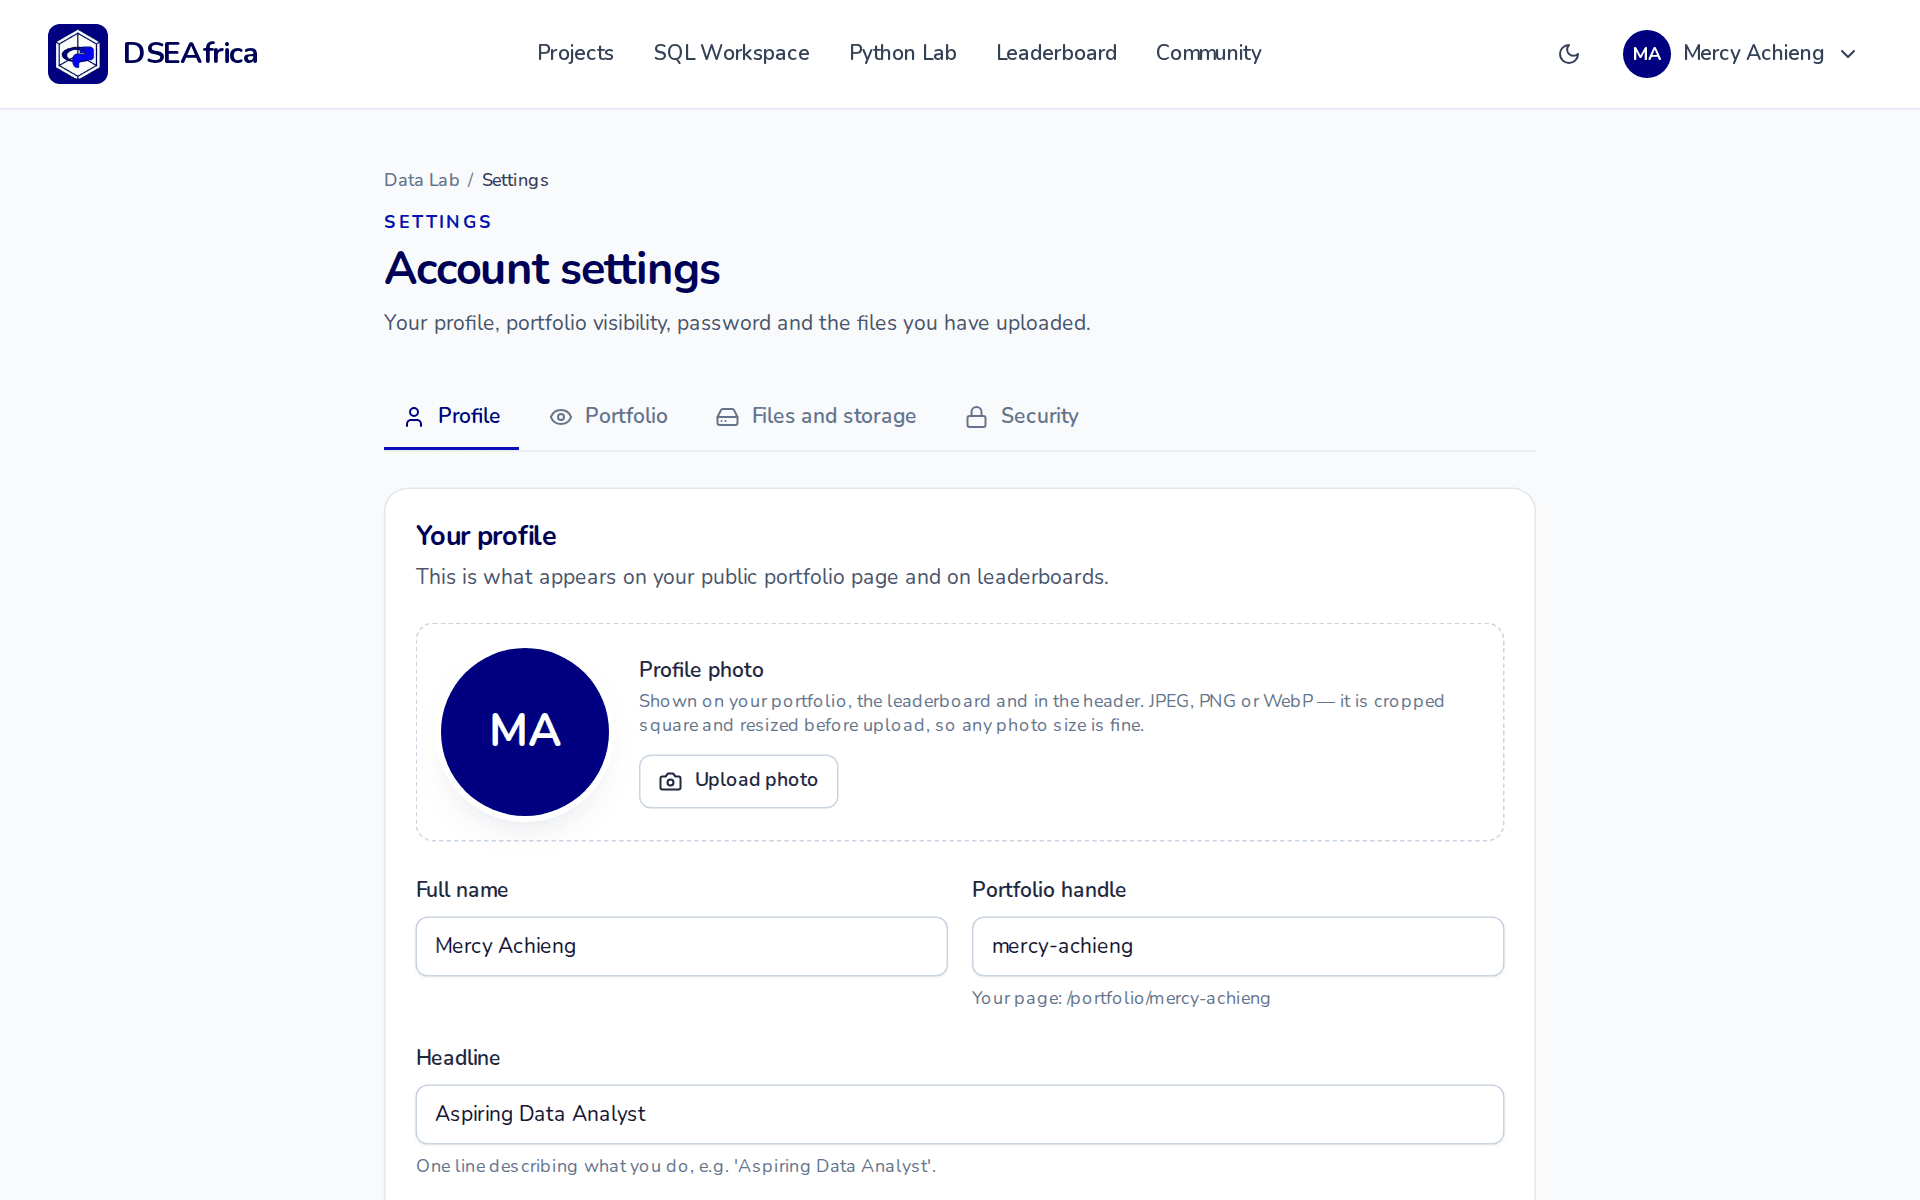
- Profile. Your handle, a short bio, your skill level and your photo. Photos are limited to two megabytes.
- Portfolio. Whether your portfolio page is public or private.
- Files and storage. Every file you have uploaded, how much space it uses, and a way to remove files that are not locked to a marked submission.
- Security. Change your password. You need your current password to set a new one.
Chapter 13
Plans and billing
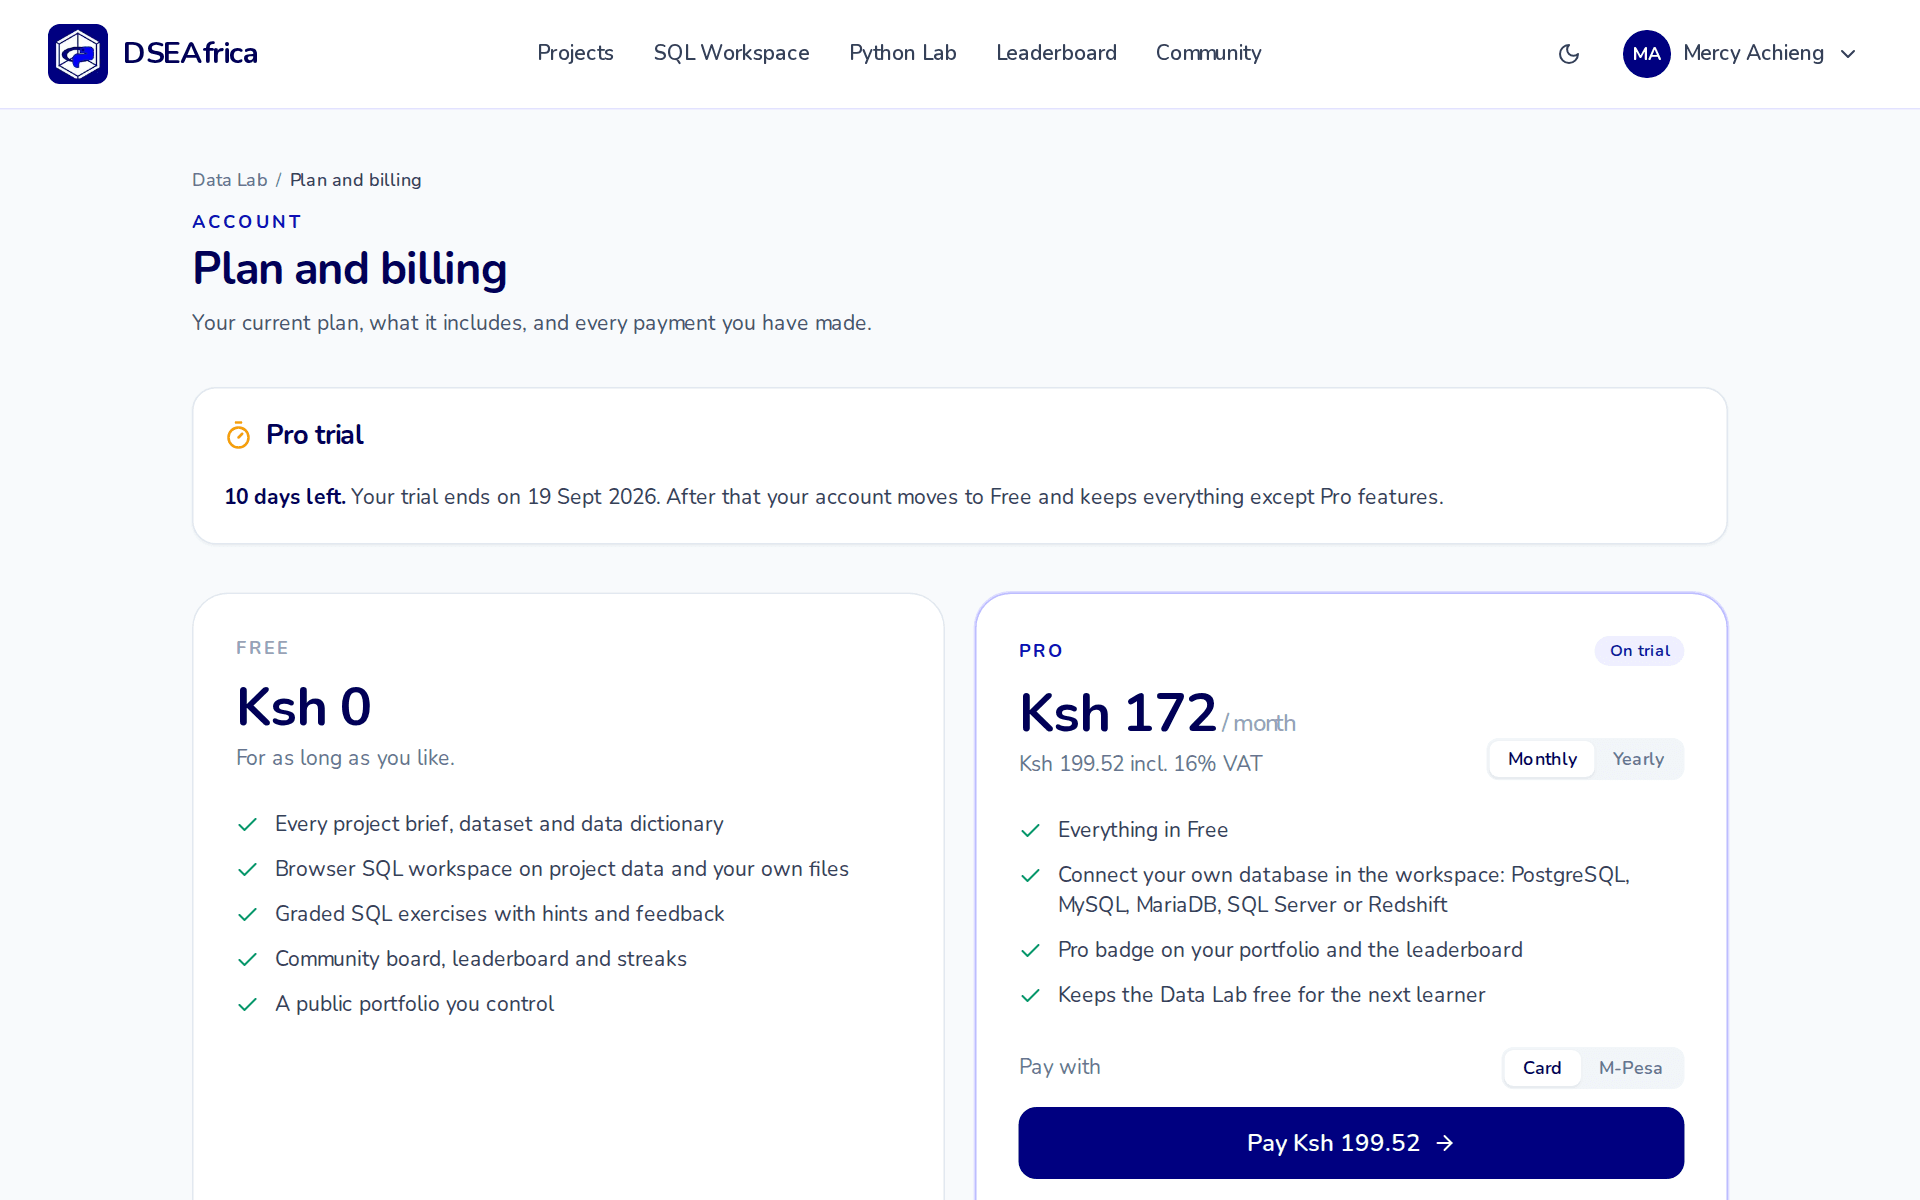
Every new account starts with a ten-day Pro trial. No card is needed. When it ends, your account moves to Free and nothing is deleted.
- Free includes every brief and dataset, the browser SQL workspace, graded exercises, submissions and marking, the community, the leaderboard and your portfolio.
- Pro adds the ability to connect your own external databases in the workspace, and a Pro badge on your portfolio and the leaderboard.
Paying
Open Plan and billing, choose monthly or yearly, choose card or mobile money, and click pay. Payments are handled by Paystack and accept M-Pesa, M-Pesa Till, Airtel Money, Pesalink and local or international cards. Your card and mobile money details never touch our servers. Prices are shown with VAT included.
A single payment buys one month or one year and simply ends. If you would rather not think about it, choose Renew automatically with a card; you can cancel renewal from the same page in one click and Pro stays on until the paid-until date. Every payment is listed under Payment history with its reference.
Chapter 14
For mentors
Mentor accounts see an extra Mentor area once an administrator has approved them.
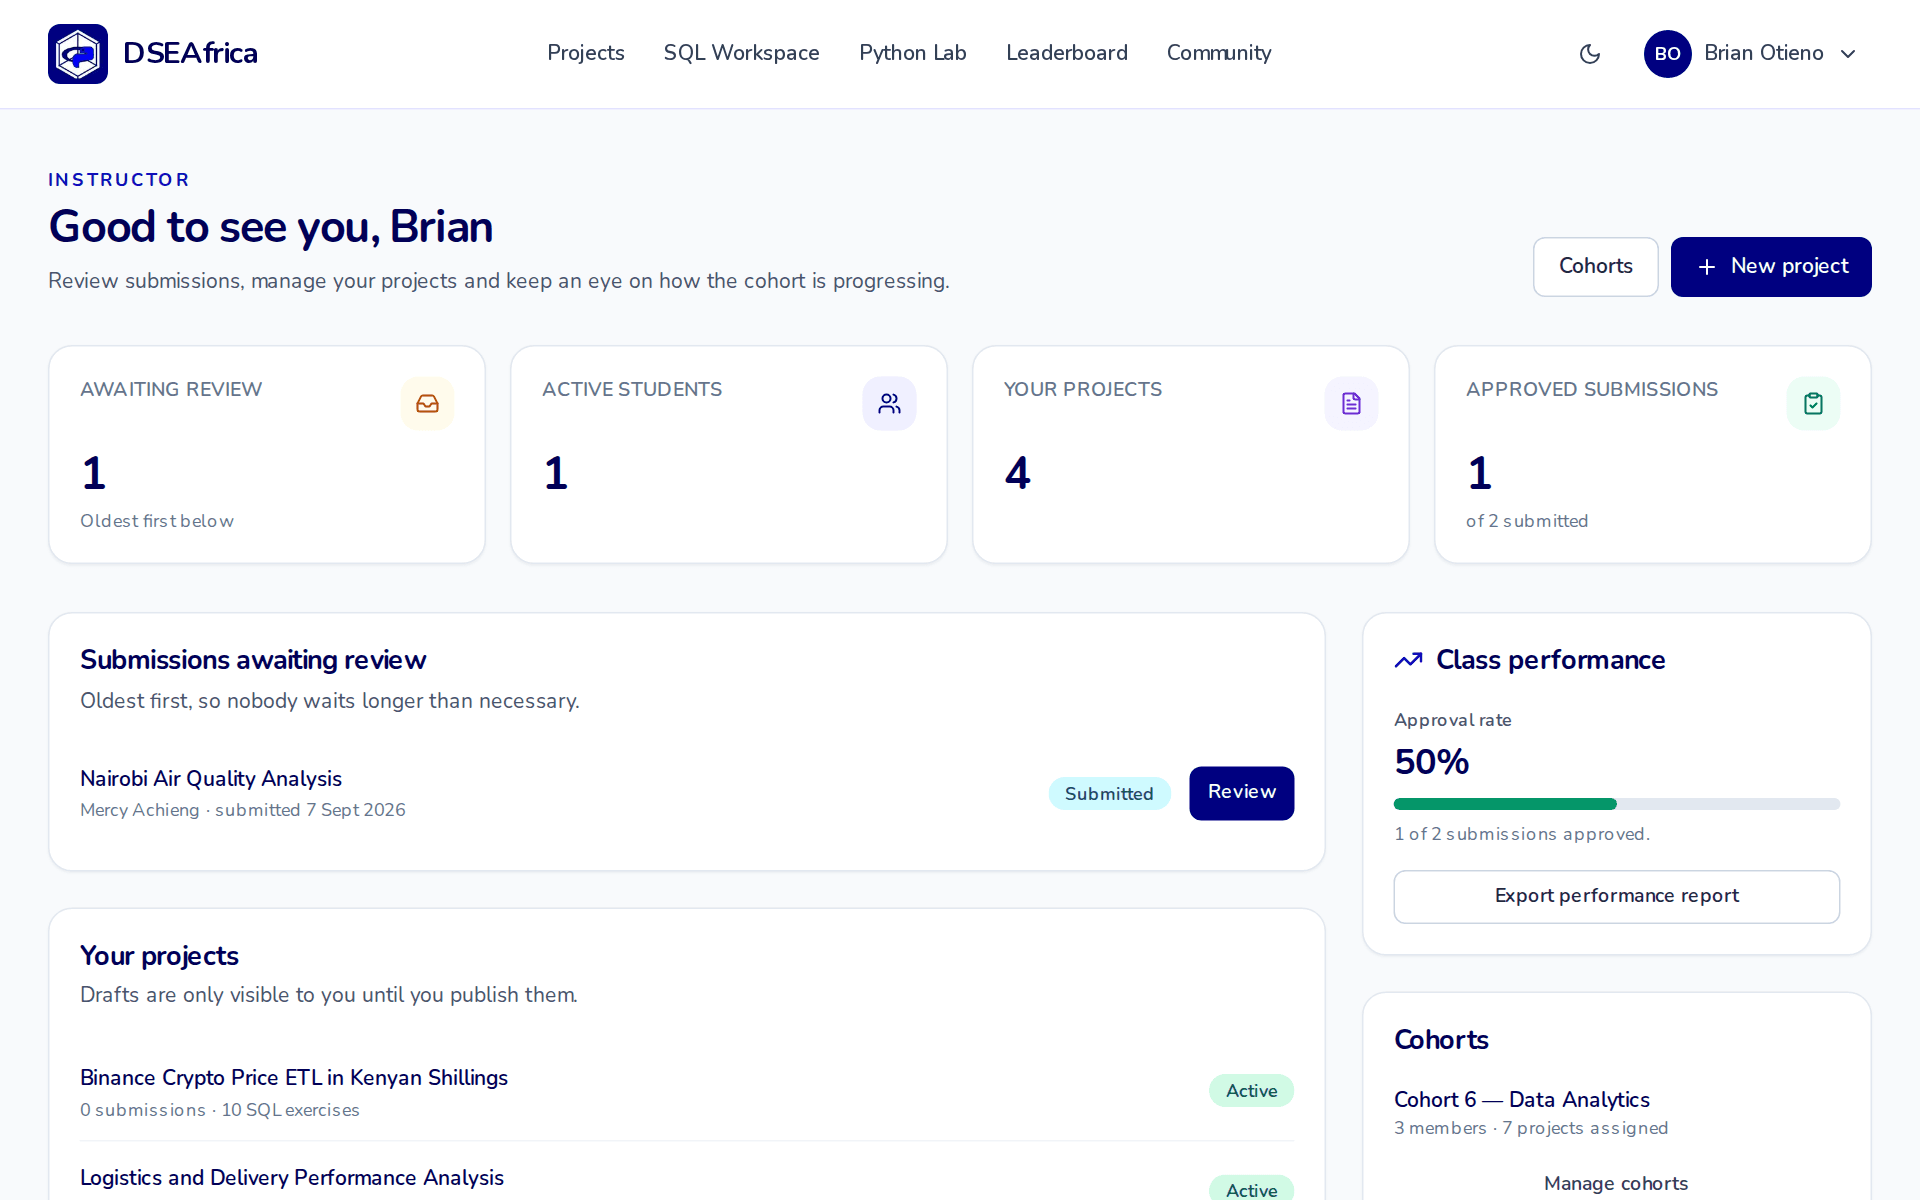
- Review queue. Submissions oldest first. Open one to see the files, links and the learner's note.
- Marking. Score each rubric criterion with a comment; the weighted total updates as you go. Choose Pass, Revise or Fail and the learner is notified.
- Projects. A wizard for creating a new brief: scenario, role, data dictionary, milestones, deliverables and rubric.
- Cohorts and reports. Group learners, assign projects, and export a class performance report as CSV.
- Moderation. Pin, lock and delete on the community board.
Chapter 15
Troubleshooting
I cannot sign in
Check that you verified your email. Use Forgot password? on the sign-in page to get a reset link. Reset links expire, so use the most recent one.
The workspace will not start
The engine runs on WebAssembly and needs a current browser. Update Chrome, Edge, Firefox or Safari, make sure no extension is blocking scripts on the page, and reload. Private browsing modes in some browsers limit the memory available and can stop large files loading.
My uploaded file does not appear as a table
Check the file opens correctly on your machine and is one of CSV, Excel, JSON or Parquet. A file with an unusual delimiter or encoding may need saving again as UTF-8 CSV.
Connecting to my database fails
Confirm the host is reachable from the internet, the user has read permission, and the port is open. Addresses on private or local networks are refused. Connecting needs Pro after the trial.
A payment went through but I am still on Free
Reload Plan and billing. If the payment is listed but Pro is not on, write to us with the reference shown in Payment history and we will sort it out.
Chapter 16
Contact
Questions about the platform go to the community board, where a mentor or another learner will usually answer quickly. For account or billing matters, write to datascienceeastafrica@gmail.com.